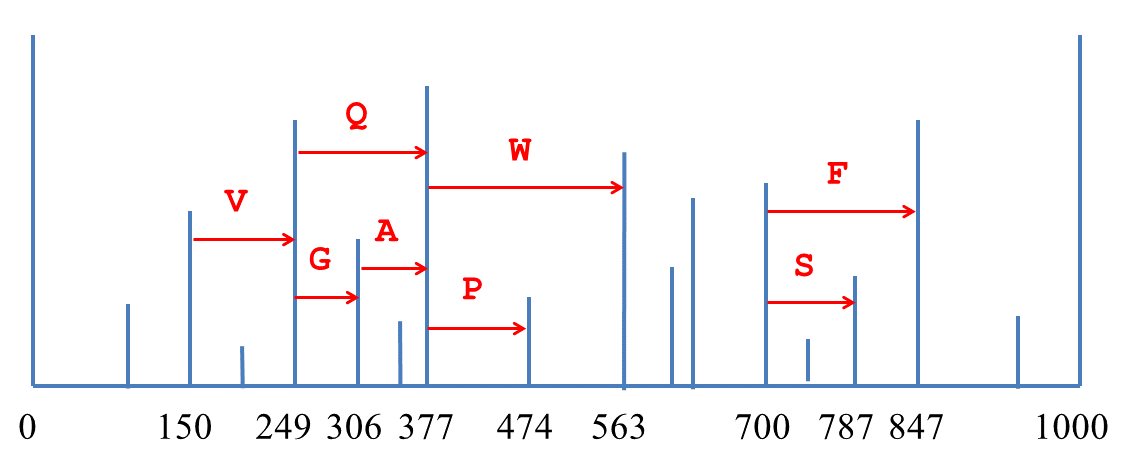
Figure 1. Spectral graph for a “toy” MS/MS-spectrum with neutral monoisotopic masses. Its vertices correspond to the peaks, and the edges are defined by pairs of vertices separated by the mass of an amino acid residue. Each edge is directed towards the vertex with a larger mass.