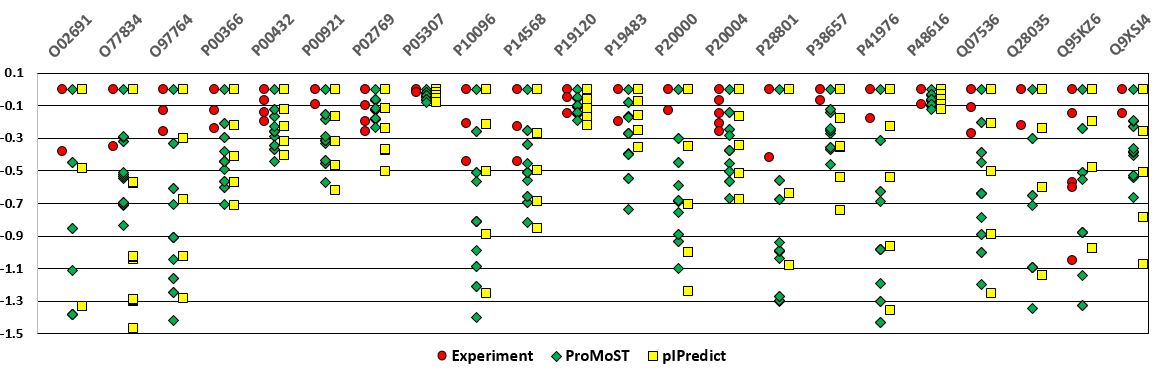
Figure 4. An example of comparison of predicted pI values for the virtual proteoforms (probable PTMs include phosphorylation of threonine or serine residues and deamination of glutamine or asparagine residues, and their combination) with the experimentally observed proteoforms obtained by analysis of the Bos Taurus kidney tissues [9]. For these proteins several variants of the position (red points) were found. The y-axis is the shifts of proteoforms pI values (the most basic value is set as zero). The hypothesis about nature of detected variants can be made for the proteins: O02691, O77834, P10096, P14568, P41976, Q28035, Q95KZ6.