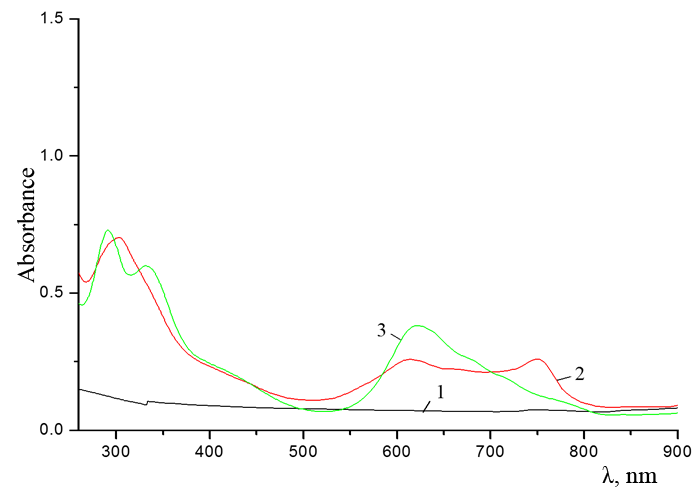
Figure 5. Absorption spectra of (a) (1) CTAB, (2) Cocr8Pc + CTAB, and (3) H2cr8Pc + CTAB at Cocr8Pc, H2cr8Pc, and CTAB concentrations of 1.25•10–5, 9•10–6, and 8.6•10–3 M, respectively.