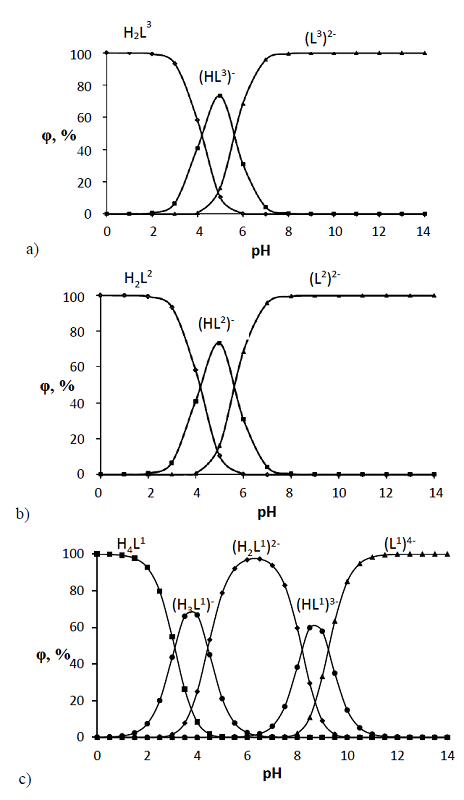
Figure 5.
Species distribution diagrams for
L
3
(a),
L
2
(b), and
L
1
(c).