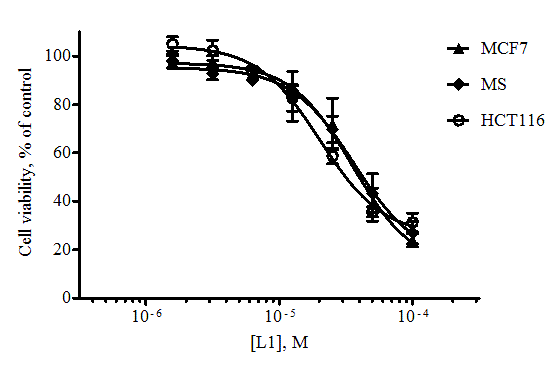
Figure 2. Dose-dependent curves for alantolactone L1 when exposed to the tumor cell lines obtained as a result of the MTT test (48 hours exposure, n = 3, error bars mean ± SD of the value).