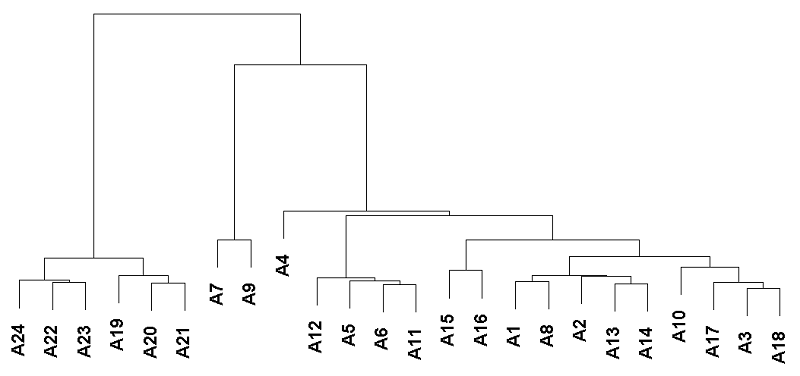
Figure 2. Sample cluster analysis. All data from the two biochips were clustered by the similarity of fluorescence values after sorting the data by the significance level of the detected fluorescence signal (p≤0.05).