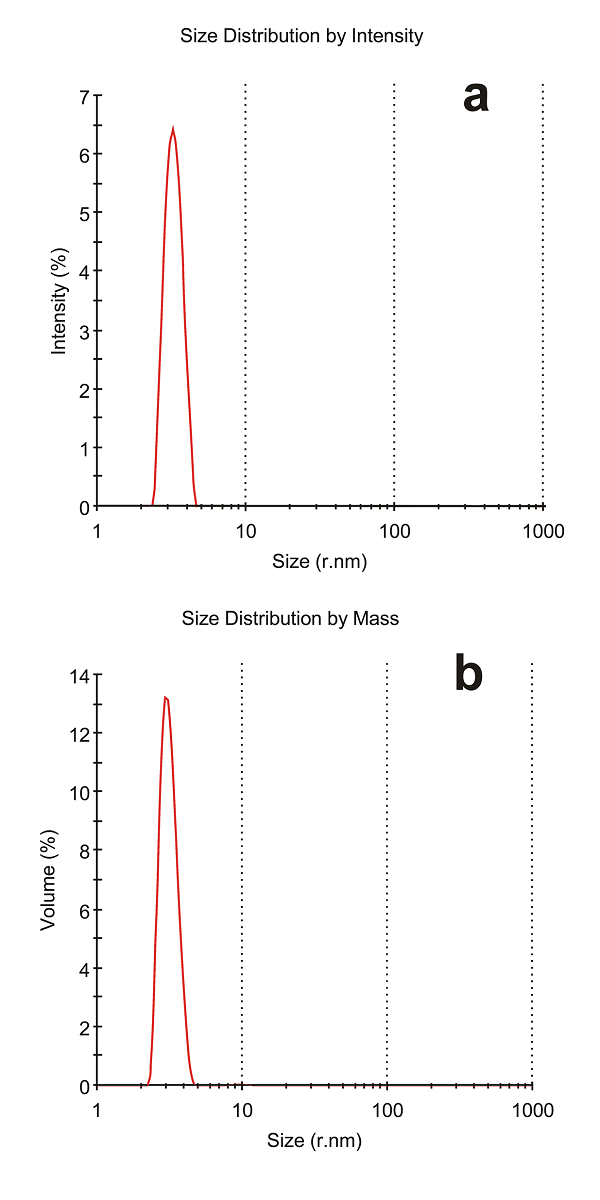
Figure 3. An example of the particle size distribution analysis by intensity of light scattering (A) and by mass (B) of the protein sample containing ADR protein (Mw 54 kDa) on the ZetaSizer MicroV (Malvern, USA). Additional information: monodisperse peak №1, 3.224 ± 0.432 nm, estimated molecular weight 52.1±7.2, % Intensity 96.8, %Mass 99.3, y-intercept is equal to 0.837 (correlogram).