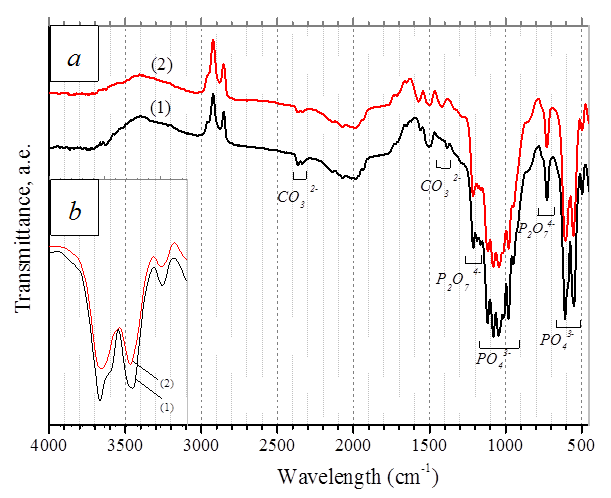
Figure 3. FTIR spectra of the initial TCP granules (1) and soaked in 2xSBF during 24 h (2), (a) – an overall view, (b) – detailing of the phosphate band.