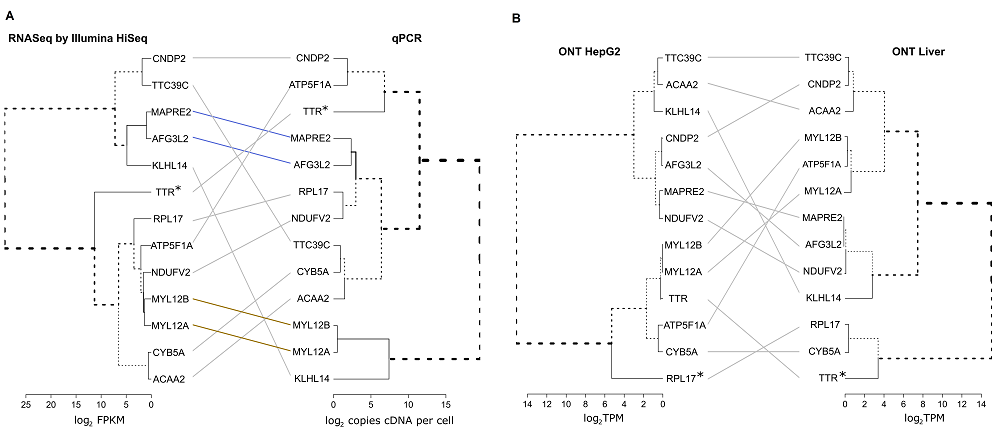
Figure 1. Tanglegram of the most heavily expressed “Stakhanovite” genes with (a) different methods and one sample (human liver) and (b) by
the same method, applied for different biospecimens (liver versus HepG2 cell line). Dendrograms were obtained using differences between the
estimations of the expression levels as measured by qPCR, Illumina HiSeq and ONT methods and scaled for convenient representation.
* indicates the most highly expressed genes.
Dendrograms were built using Ward’s clustering and the Euclid distance between log2-transformed data. The Dendextend package [47] was used to
draw tanglegrams and compute entanglement.