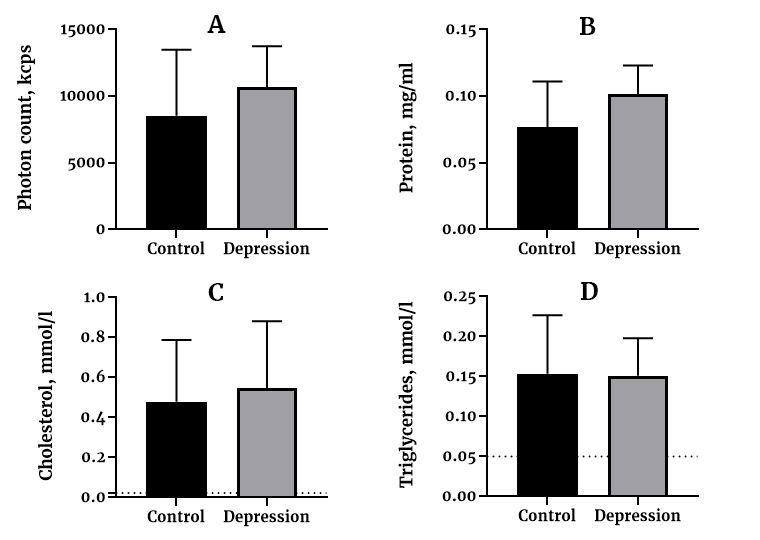
Figure 1. Biochemical parameters in the control and depression groups. A) Particle concentration according to dynamic light scattering data; B) protein concentration in sEV, mg/ml; C) the concentration of cholesterol in sEV, the dashed line indicates the detection limit, 0.023 mmol/L; D) the concentration of triglycerides in sEV, the dashed line indicates the detection limit, 0.05 mmol/L.