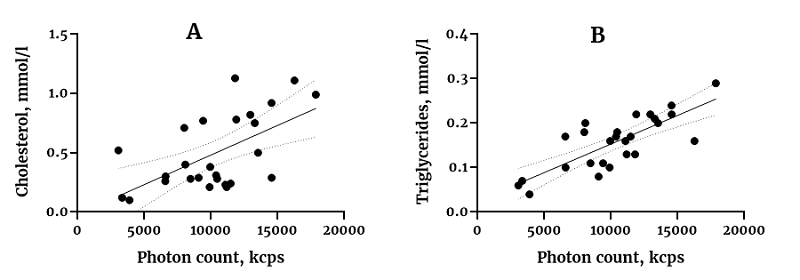
Figure 2. Correlation of particle concentration with A) cholesterol concentration and B) triglyceride concentration in sEV. The straight line represents best fit with linear regression, and the dotted line represents the 95% confidence interval.