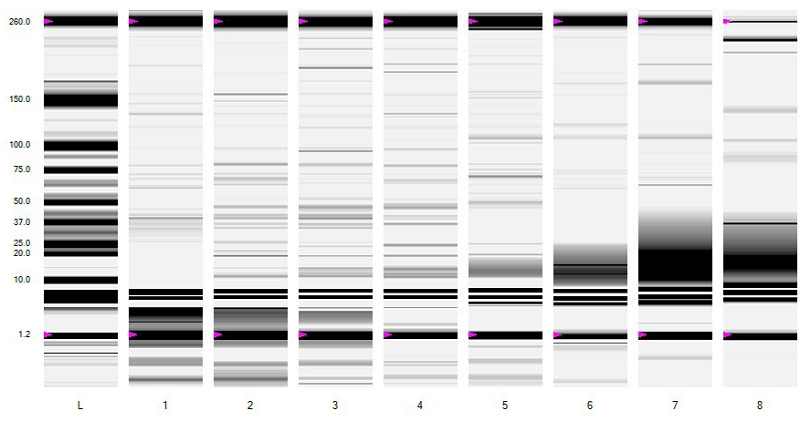
Figure 3. Electrophoregram of protein extracts obtained with and without mechanical disintegration. L- Experion Pro260 ladder calibration scale. The calibration scale contains 9 proteins with a mass range from 10 to 260 kDa, as well as a 1.2 kDa marker. The electrophoretogram of the calibration scale displays a lower 1.2 kDa marker following the system peaks and 9 proteins on the scale. Protein peaks in each sample well are capped at 1.2 kDa for the lower marker and 260 kDa for the upper marker. These markers are used to normalize the time of protein migration into sample wells using a calibration bar. (There is always a system peak after the 1.2 kDa low marker.) 1-4 protein extracts obtained using mechanical disintegration, 5-8 protein extracts obtained without the use of mechanical disintegration. 1, 5 - strain B. anthracis ∆Sterne in lysis buffer with urea, 2, 6- strain B. anthracis ∆Sterne in lysis buffer with guanidine chloride, 3, 7 - strain B. anthracis 1284 in lysis buffer with urea, 4, 8 - B. anthracis strain 1284 in lysis buffer with guanidine chloride.