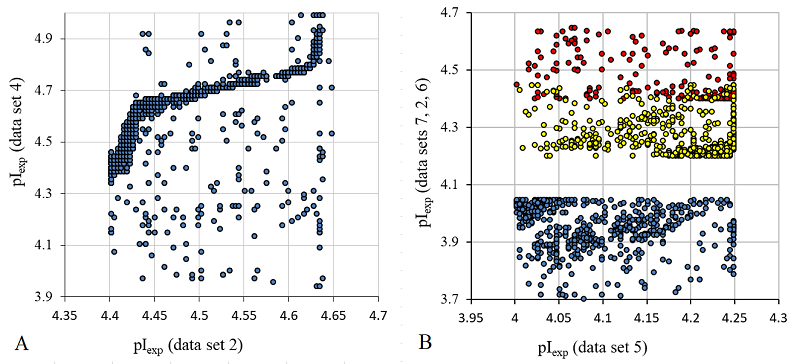
Figure 1. The pairwise comparison of experimentally determined pI values (pIexp) for the peptides available in each of the sets. A. Set 2 versus set 4. B. Set 2 (red), 6 (yellow), and 7 (blue) relative to set 5.