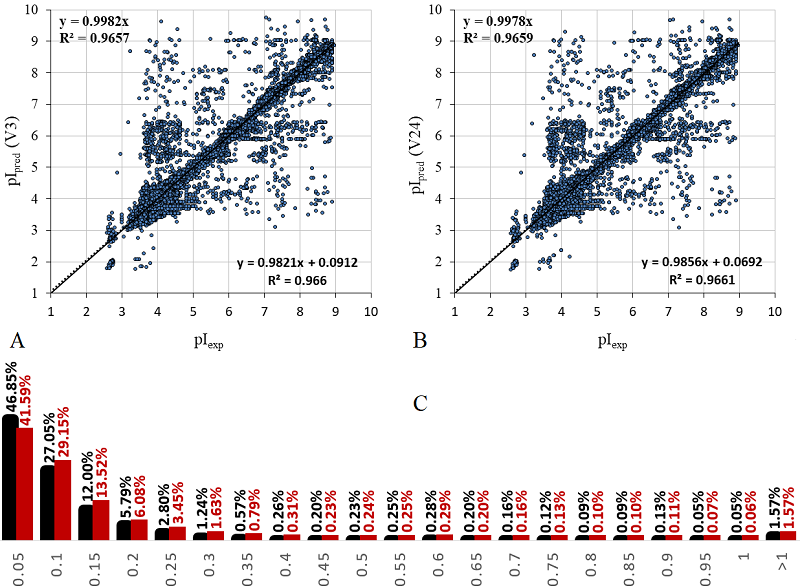
Figure 3. The comparison of learning results without (A, red bars in the histogram) and including (B, black) neighboring residuals. C. The distribution of peptides by absolute error of prediction in learning.