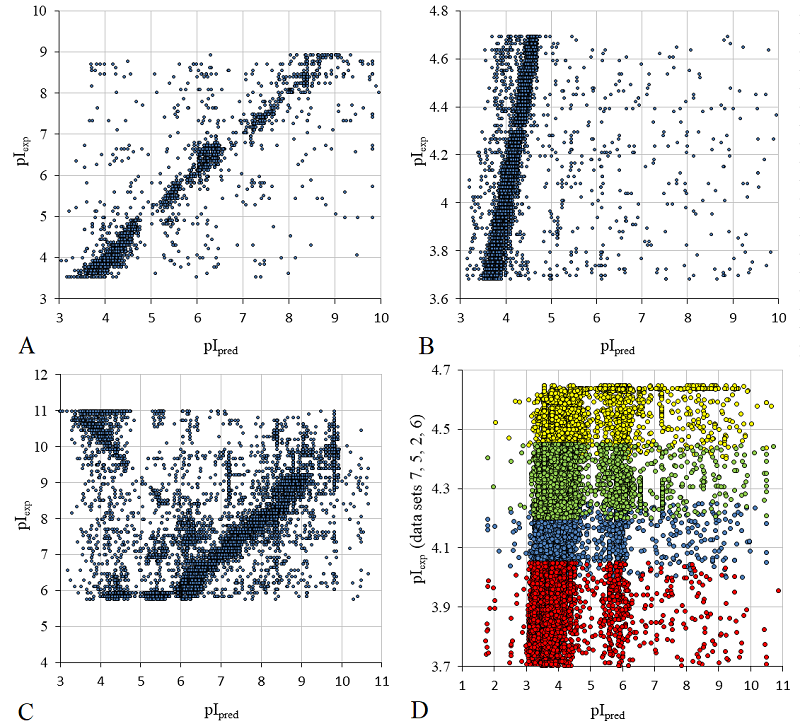
Figure 4. The comparison of experimental pI values of peptides not including in the training sample with pI values predicted by the scale with neighboring residuals accounting. A. Set 19. B. Set 18. С. Set 24. С. Set 2 (yellow), 5 (blue), 6 (green), and 7 (red).