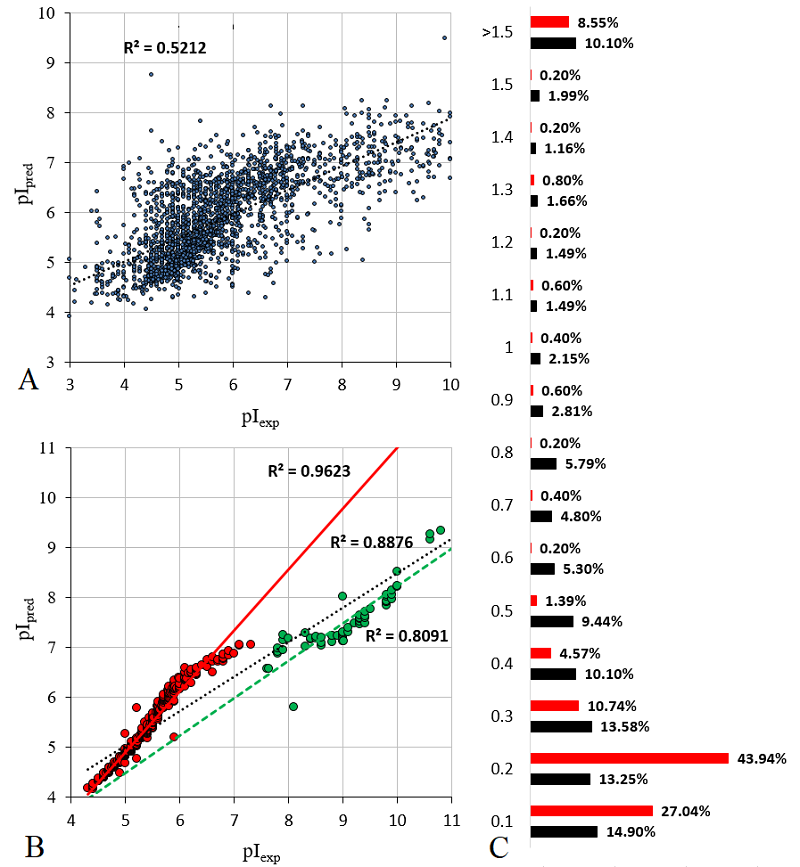

Figure 6. The comparison of predicted (pIpred) pI values with experimentally determined ones (pIexp) for the set of proteins from work [15] (A, black in the histogram) and the set of proteins from work [27] (B, red). C is the histogram of the distribution of the absolute error of prediction.