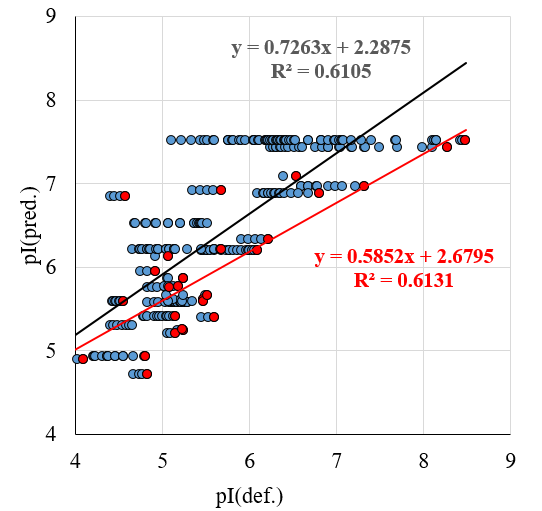
Figure 3. The comparison of the assigned pI values and the values predicted by the method of Bjellqvist et al. for the data set from the 2D electrophoretic CSF_HUMAN map (one point without modifications with ΔpI >3 was discarded). Blue is all variants, red is only one most basic variant for each of the proteins.