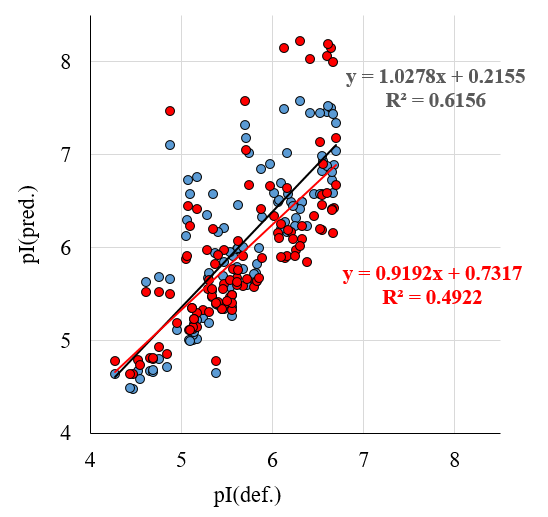
Figure 4. The comparison of the assigned pI values and the values predicted by the methods of Bjellqvist et al. (red) and pIPredict 3 (blue) for the data set from the 2D electrophoretic map RAT_INS1E_4-7.