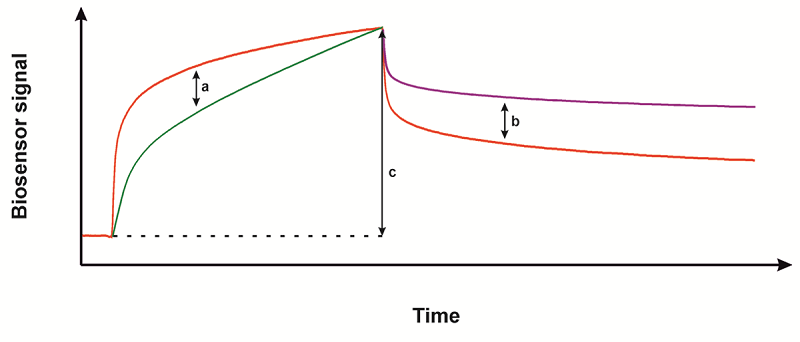
Figure 2. Critical parameters of sensorgrams, according to which the screening results are evaluated. a - slope (the red curve is more favorable than the green one), b - slow dissociation (the purple curve is more advantageous than the red one), c - the maximum amplitude of the sensorgram (the larger this value, the more preferable the curve).