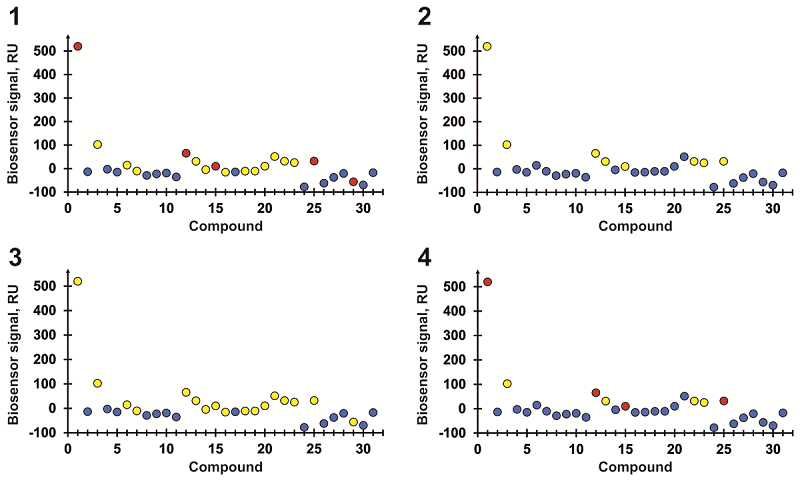

Figure 3. Results of screening a sample of 33 naturally occurring compounds for interaction with C. krusei CYP51. The abscissa shows the numbers of compounds, the ordinate shows the maximum amplitude of the sensorgram. The colors indicate the result of the assessment: red - a positive result according to two criteria for evaluating the sensorgram, yellow - a positive result according to the slow dissociation criterion, blue - a negative result. Sensitivity settings: 1 - maximum sensitivity for slope and slow dissociation, 2 - minimum sensitivity for slope and slow dissociation, 3 - minimum sensitivity for slope and maximum for slow dissociation, 4 - maximum sensitivity for slope and minimum for slow dissociation.