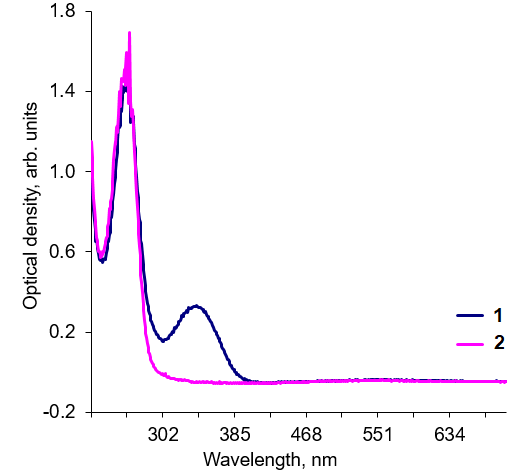
Figure 2.
Spectra of 0.1 mM NADPH (curve 1) and 0.1 mM NADP (curve 2) in bidistilled water.