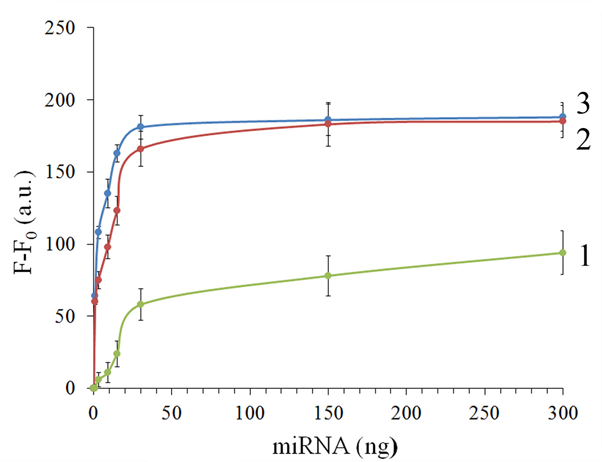
Figure 2. Detection selectivity. The difference between fluorescence in the presence (F) and the absence (F0) of miRNA at 1 h incubation time for various combinations of miRNAs. Cas13a in the complex with gRNA targeting miR-34a (1), miR-218 (2), and miR-145 (3). Blue bars – the mixture of three miRNAs; red bars – the mixture of two miRNAs not matching the gRNA. 30 ng of each miRNA per reaction tube. The mean values and the corresponding standard errors for three independent measurements are shown.