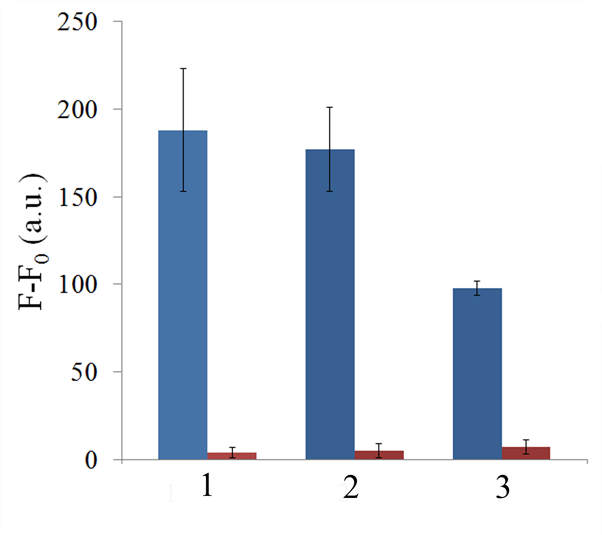

Figure 3. Detection sensitivity. The difference between fluorescence in the presence (F) and the absence (F0) of miRNA at 1 h incubation time as a function of miRNA amount in the reaction tube. Curves 1, 2, and 3 – miR-145, miR-218, and miR-34a, respectively. Lines are drawn to guide the eye. The mean values and the corresponding standard errors for three independent measurements are shown.