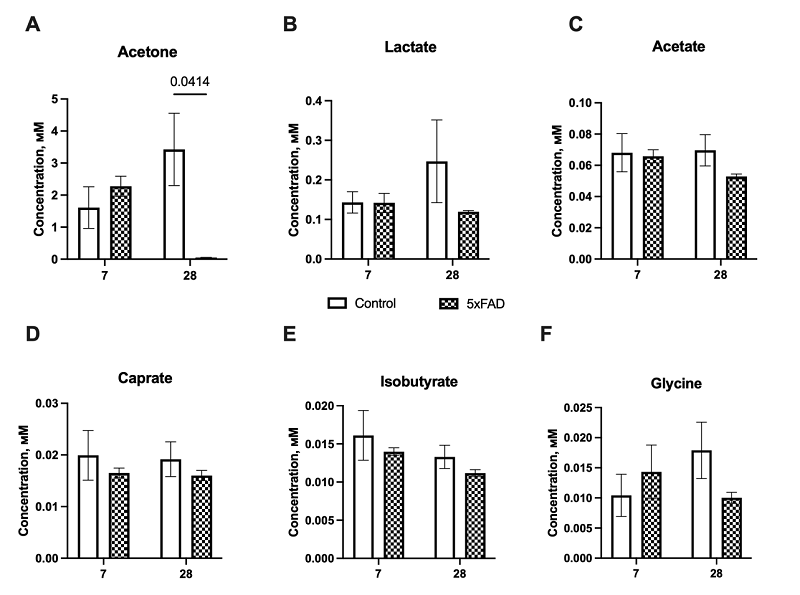
Figure 3. Comparison of metabolite concentrations in the interstitial fluid of the hippocampus in wild-type mice (Control) and the 5xFAD line on days 7 and 28 after training. Values are expressed as M ± SEM. Statistical analysis was performed using Two-way ANOVA with Sidak's correction.