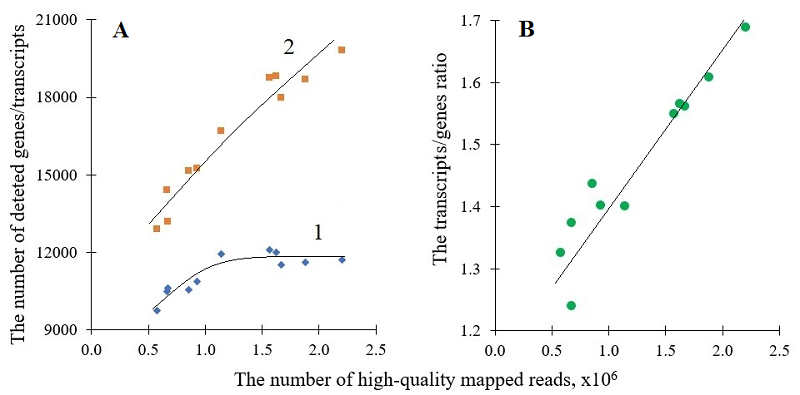
Figure 1. The numbers of detected genes and transcripts and the ratio of these numbers as a function of sequencing depth. The sequencing depth is presented as the number of high-quality mapped reads produced in single MinION runs. Panel A: the number of revealed genes – curve 1; the number of revealed transcripts – curve 2. Panel B: the transcript/gene ratio is a ratio of the number of revealed transcripts (splice variants) to the number of revealed genes.