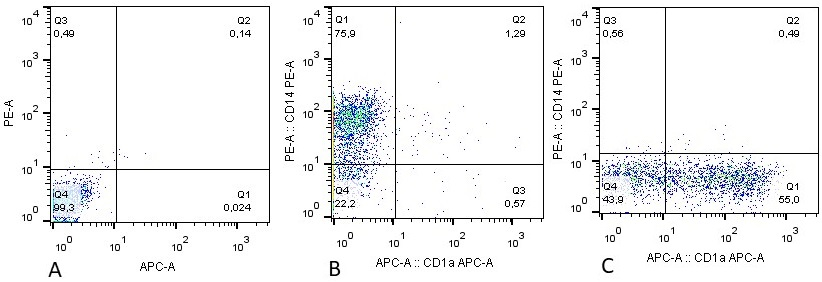
Figure 2. Expression of the monocyte/macrophage marker CD14 and the immature dendritic cell marker CD1a on cells after 5 days of cultivation. A – unstained control. B – cells cultured without GM-CSF and IL-4. C – cells cultured in the presence of GM-CSF and IL-4 in the medium. Fluorescence intensity is shown on both axes. The percentage of cells included in each quadrant is indicated.