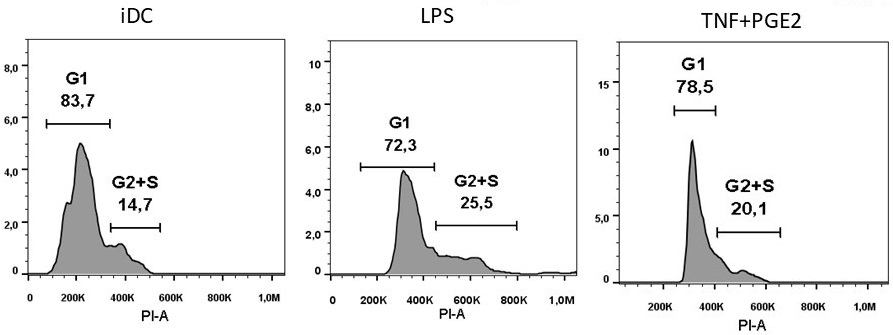
Figure 4. Distribution of lymphocytes across cell cycle phases during co-cultivation with immature (iDC) or mature (LPS; TNFα+PGE2) dendritic cells. The x-axis represents fluorescence intensity; the y-axis represents the number of recorded events (cells).