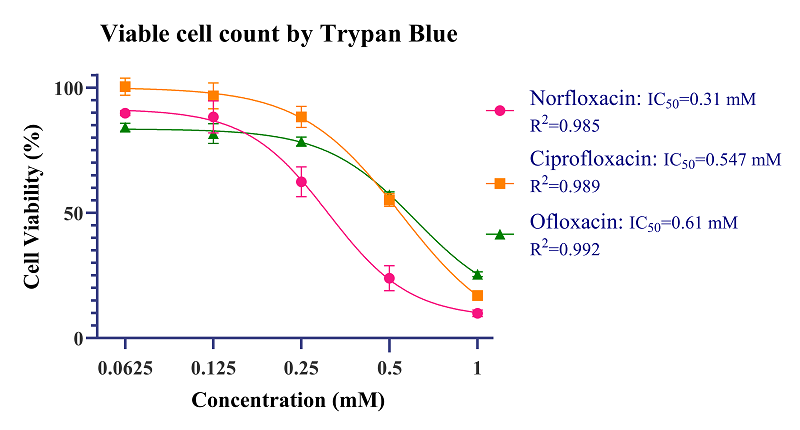
Figure 1. Survival curves of HCT-116 wt cells after the addition of certain second-generation fluoroquinolones. The X-axis shows the concentration of fluoroquinolones in mM, and the y-axis represents the percentage of viable cells relative to the control, as counted by trypan blue exclusion. R2, the coefficient of determination.