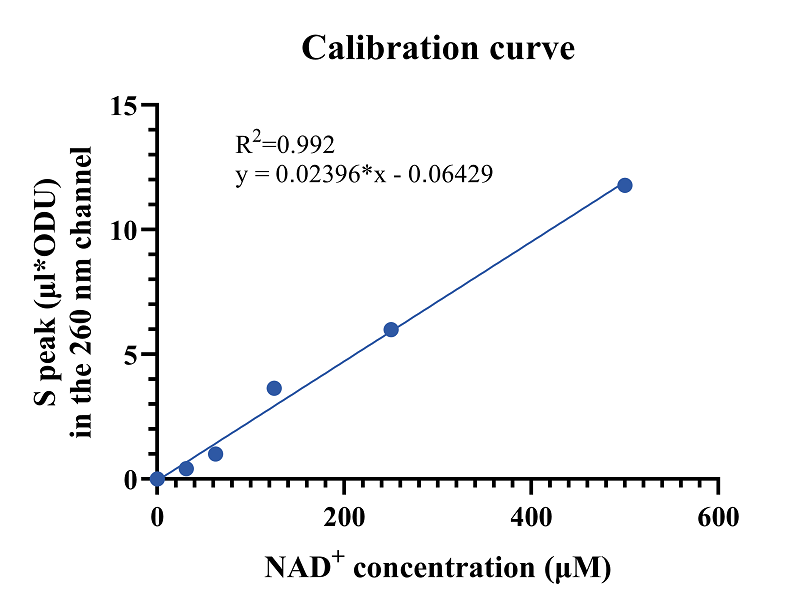
Figure 2. Calibration curve for the analysis of NAD+ concentration in cell lysates. The X-axis shows the NAD+ concentrations (concentration range: 500 µM, 250 µM, 125 µM, 62.5 µM, 31.25 µM). The Y-axis – the peak area in µL × optical density units (ODU) at a UV detector wavelength of 260 nm. The graph also shows the equation of the calibration curve and the correlation coefficient (R²).