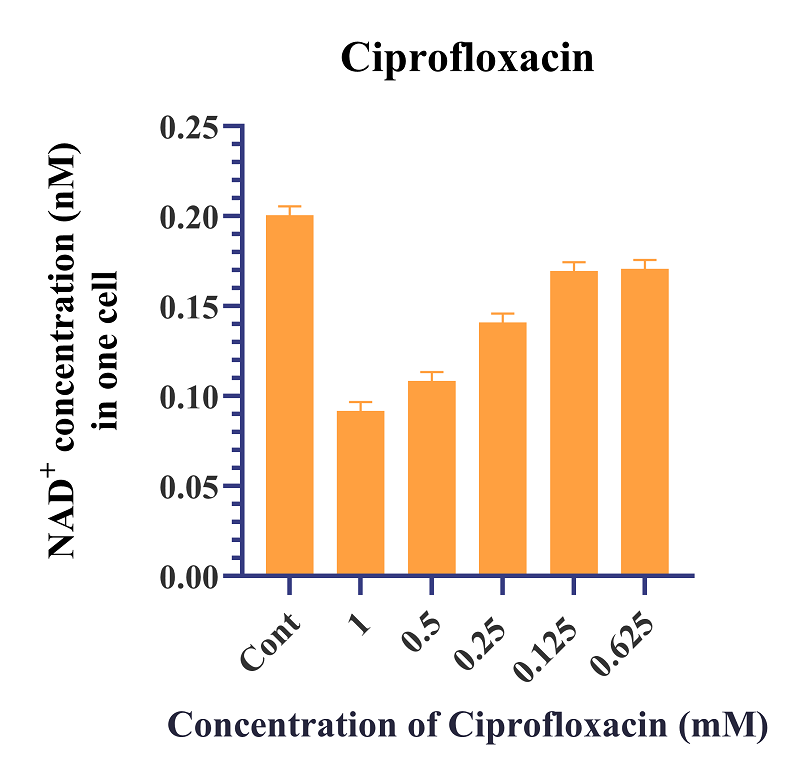
Figure 4. Intracellular NAD+ concentration per cell after ciprofloxacin treatment. Similar to Figure 3, the graph demonstrates the concentration of NAD+ per cell (nM, y-axis) in response to varying concentrations of ciprofloxacin (mM, x-axis), showing an increase in NAD+ with decreasing antibiotic concentration.