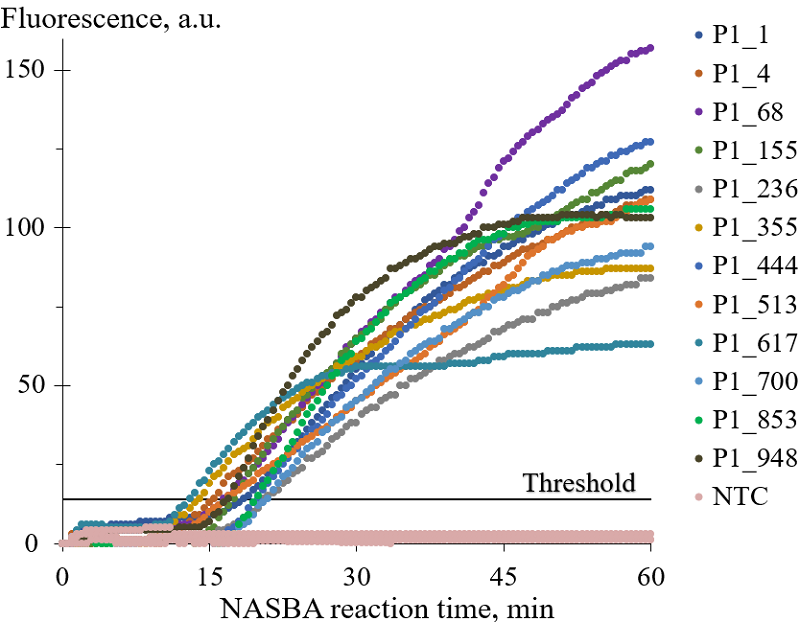
Figure 1. Representative amplification curves. NASBA conducted with 0.1 pg of C. sepedonicus total RNA (10,000 copies of 16S ribosomal RNA per tube) and different sets of primers. The curve color indicates a particular primer P1 used (Table 1) as shown on the right of the figure. NTC (no template controls) for each primer set gave amplification curves which are practically coincide. The horizontal line marked as “Threshold” is automatically set by a thermocycler software to calculate Cp (crossing point) values. a.u. – arbitrary units.