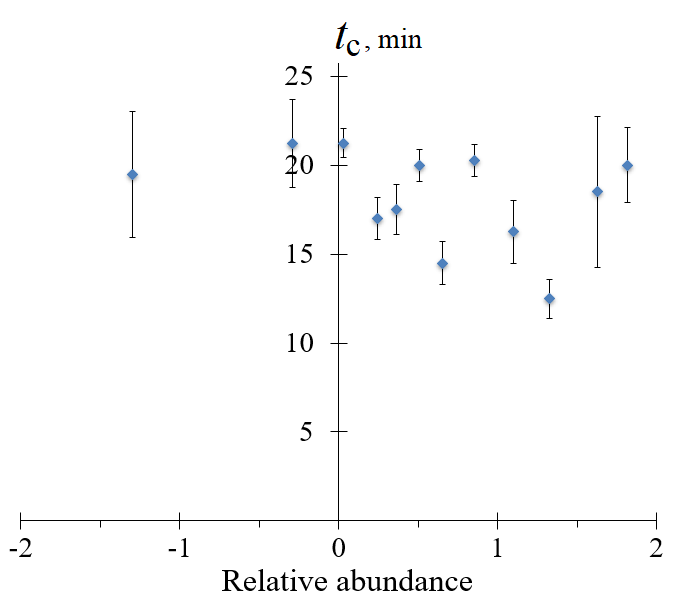
Figure 2. Dependence of characteristic amplification time (tc) on relative abundance for different sets of NASBA primers. The tc values are calculated based on Cp values and the cycle duration (0.5 min). The relative abundance values are taken from Table 1. The mean values and corresponding standard deviations for 3 to 5 independent experiments are shown.