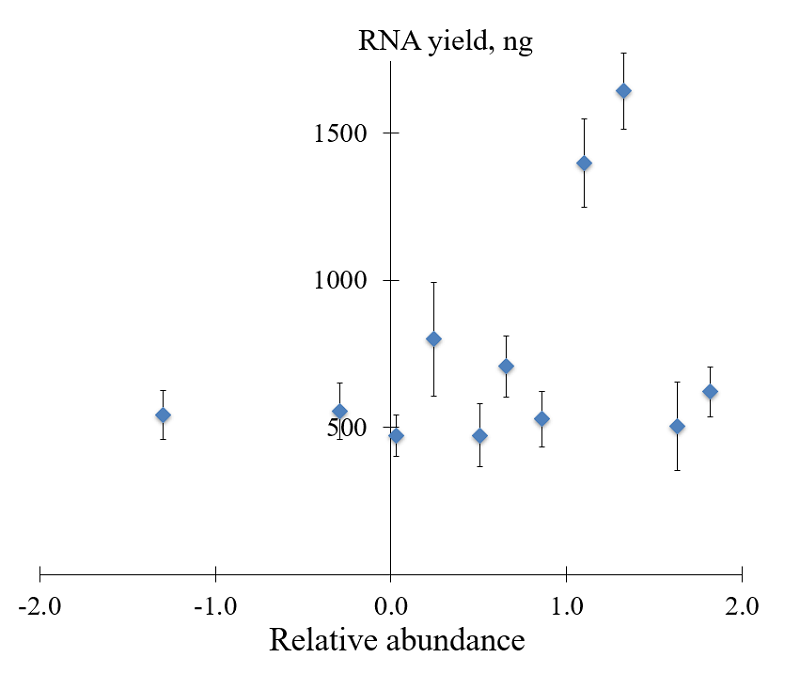
Figure 3. The total yield of RNA in NASBA with variants of primer P1, characterized by different relative abundance values (Table 1). The mean values and corresponding standard deviations for 3 to 5 independent experiments are shown.