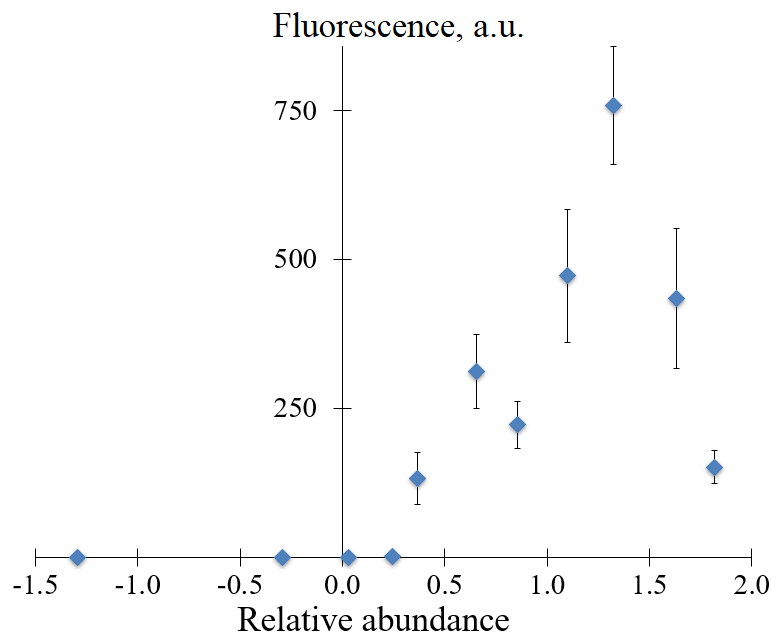
Figure 5. The yield of target RNA amplicons in NASBA with different variants of primer P1 as a function of relative abundance. The relative abundance values as in Table 1. The yield is presented as total fluorescence intensity (in arbitrary units, a.u.) of an electrophoretic band corresponding to target RNA amplicons (as indicated in Fig. 4). The mean values and corresponding standard deviations for 3 independent experiments are shown.