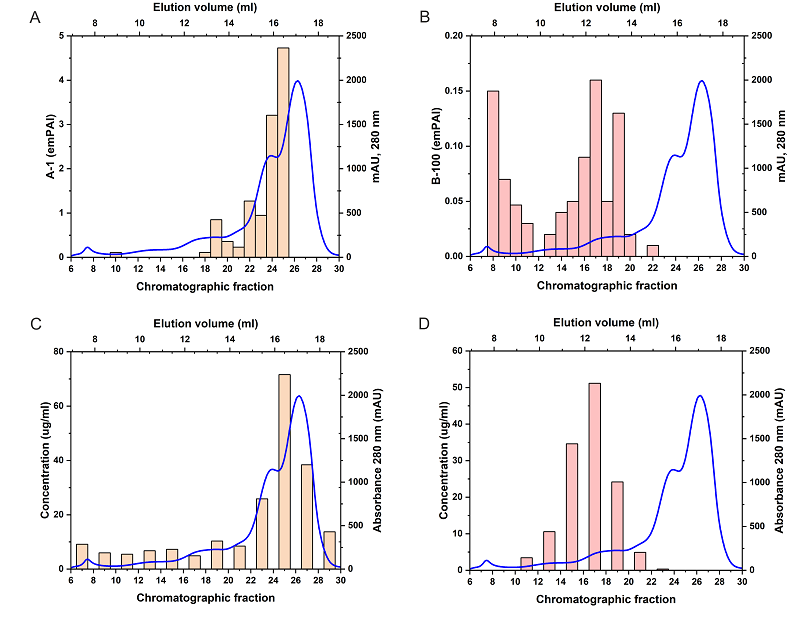
Figure 1. Chromatogram of human blood plasma and distribution of A-1 and B-100 in fractions. Blue – chromatogram of blood plasma according to optical density data at a wavelength of 280 nm, yellow – distribution of A-1 in chromatographic fractions according to the emPAI value (A) and ELISA (C), pink – distribution of B-100 in chromatographic fractions according to the emPAI value (B) and ELISA (D).