The Prediction of the Ion Fraction of the Peptide with Selected Charge in Mass Spectrometry with Positive Electrospray Ionization
Institute of Biomedical Chemistry, 10 Pogodinskaya str., Moscow, 119121 Russia; *e-mail: vladlen@ibmh.msk.su
Keywords:peptide; mass-spectrometry; electrospray ionization; property prediction
DOI:10.18097/BMCRM00100
The possibility of prediction of selected ion fraction in the total peptide fraction obtained during mass spectrometry with positive ionization by electrospray was investigated on the basis of the amino acid sequence. The data obtained in the MS / MS experiment [Ramus et al., 2015] using the standardized UPS1 kit (48 highly purified human proteins) and deposited in ProteomeXchange (identifier PXD001819) were used as the initial data set. For each of the identified peptides belonging to one of the proteins of the UPS kit, a list of detected ions of different charge was formed. The sum of the peak intensities detected for the primary ion was used as a measure of quantity. Since the ratio of the peptide fractions of ions with different charges does not depend on the concentration in the experimental sample, the total sample was assembled by combining the data obtained for different dilutions of UPS1. A set of equations of prediction of the fraction of 1+, 2+, and 3+ ions has been constructed. This computational analysis has shown applicability of the proposed for prediction of the ion fraction of the peptide with selected charge in mass spectrometry with positive electrospray ionization.
INTRODUCTION
Mass spectrometry (MS) is currently the main tool for proteomic studies [1]. Among the various ionization options, soft ionization methods such as electrospray ionization (ESI) are widely used. During analysis of peptides, e.g., by tandem mass spectrometry (MS/MS), the number of ions of a certain charge depends on the equipment used, experimental conditions (applied voltage, solution concentration and flow rate, etc.), and solvent composition [2]. At the same time, it is obvious that the distribution of ions during ESI under the same conditions is primarily determined by the amino acid sequence of the peptide. Thus, when planning an experiment (e.g., choosing a hydrolysis method or selection of a working window for recording ions with given m/z values, choosing conditions for tracking ions with a certain charge), it is important to know which charge states and in what fraction of the total amount of peptide can be registered. Knowing the fraction of the total amount of peptide is also important in experiments on protein quantification using mass spectrometric studies. Of course, this is only possible under a number of assumptions: the number of different peptides during hydrolysis is approximately the same and proportional to the total amount of protein; the "invisible part" or unrecorded fraction of peptides is approximately the same, etc. However, it seems that even an approximate prediction with an accuracy of 10-15% can qualitatively improve the data from a mass spectrometry experiment. This paper investigates the possibility of predicting the fraction of an ion with a specific charge based on the amino acid spectrum of a peptide (peptide sequence).
METHODS
The most important factor in such work is the availability of high-quality, or better yet, standardized data. In this work, we used data obtained in [3], deposited in ProteomeXchange [4] (identifier PXD001819). The data were obtained by mass spectrometry using a standardized set of 48 highly purified human proteins without SAP (PTM possible), both synthesized recombinantly and obtained from natural sources and presented in the sample at the same concentration (UPS1 by Sigma-Aldrich, USA). The peculiarities of the mass-spectrometric experiment include the following [3]:
- the samples for identification were prepared by the authors by mixing yeast cell lysate with a set of UPS dilutions so as to obtain final UPS1 concentrations of 0.05 fmol/mg, 0.125 fmol/mg, 0.250 fmol/mg, 0.5 fmol/mg, 2.5 fmol/mg, 5 fmol/mg, 12.5 fmol/mg, 25 fmol/mg and 50 fmol/mg in yeast lysate;
- hydrolysis was performed in solution with the addition of 2% trypsin;
- nanoLC-MS/MS was performed using nanoRS UHPLC system (Dionex, The Netherlands, coupled with LTQ-Orbitrap Velos mass spectrometer (Thermo Fisher Scientific, Germany), 3 repetitions for each dilution;
- identification of peptides was performed by the authors [3] by means two methods: using Mascot Daemon version 2.4 (Matrix Science, UK) with the accuracy of 5 ppm for the primary ion and 0.8 Da for the identification of fragments; and using a combination of MaxQuant [5] and the Andromeda search engine [6] (6 ppm and 0.5 Da).
During the analysis, we combined the data on peptide identification with data on the distribution of primary ions of different charge state (including the total intensity of all peaks for a given ion as a measure of the number of detected ions). We have extracted data on all registered primary ions from raw files using the Dinosaur software [7], which, in addition to the sum of the intensities of all peaks of a given ion, also calculates the initial time of appearance and disappearance of a given ion at the output of the chromotographic column and the time corresponding to the maximum intensity at detection (retention time or RT). The data were then grouped as follows. Groups of primary ions with different charges were considered to belong to the same peptide provided that the mass of the total peptide was within 5 ppm, the time ranges of peptide yield from the column overlapped, and the position of the maximum differed by no more than 0.2 min. When comparing with the peptides identified by the authors of [3], a primary ion was considered to correspond to an identified peptide if the m/z values of the equally charged ions coincided within 5 ppm, and the RT of the ion measured by the authors of [3] was within the RT range calculated by the Dinosaur program. The data were averaged over all available repetitions to form a set of the primary ion charge distribution. When looking for a match between the primary ion distribution data and the MS/MS identification data, the latter were used without reference to a specific dilution (see item 1 above). In the presence of modifications, data with N-terminal acetylation were not included in the sample; in the presence of an oxidized methionine residue, only the variant with the maximum total intensity was used. The data obtained as a result of this analysis are presented in the summary table of supplementary materials.
RESULTS AND DISCUSSION
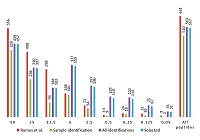
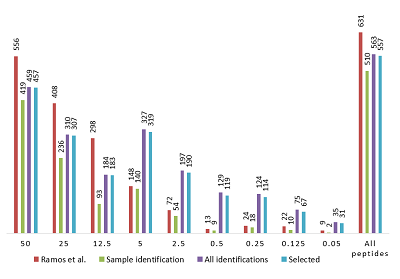
Figure 1 shows the distribution of the number of peptide identifications in each of the dilutions obtained in [3] and when the data were combined into a summary table (supplemental materials) according to the rules described in the "Methods" section. It can be seen that when using peptides identified only for the corresponding dilution, a significant part of the data was lost. A total of 121 peptides out of the 631 identified in [3] were not found to match (within individual dilutions, the differences are even greater). Of these, 69 peptides were found, but did not meet the established matching parameters for accuracy (5ppm). Another 15 peptides had to be excluded from the analysis as containing a forbidden modification (N-terminal acetylation). Taking into consideration, that in all experiments the experimental conditions differ only in the concentration of UPS1 proteins, we believe that using the data on the charge, m/z, and RT of the ion identified for a different dilutions is valid for all, since "ion selection" for fragmentation and obtaining a qualitative spectrum for identification is, strictly speaking, not deterministic and may be random in nature.
Since the total intensity is a value that depends on the device settings and random factors that vary from experiment to experiment, two sets of values were used as a measure of the number of ions with a given charge. The first set considered the fraction of the ion variant of a peptide of a particular charge (ωn+) calculated as the ratio of the sum of the intensities of this ion to the sum of all the sums of the intensities of detected ions of this peptide. For any peptide, the sum of all ωn+ values is equals to 1. In this study, we considered the charge state of ions from 1+ to 5+ (Fig. 1). There were isolated cases of 6+ ions, but they were not considered. Unfortunately, it is not possible to reliably determine the proportion of peptides without a positive charge from the experiment. The second set of values characterizes the ratio between the sums of ion intensities (Сn/m). In this study, only three pairs of ions (1+/2+, 2+/3+, and 3+/4+) were considered. The value Сn/m only makes sense if both ions exist. There is also same problem for the value ωn+ if it takes the value 0 or 1. It is not certain that the peptide predominantly exists in the form of this ion, or that the ion does not exist at all. Perhaps this ion or other peptide ions were simply not registered or were incorrectly identified by the software.
|
Figure 1.
The distribution of peptides in serial dilutions obtained in [3] and data combined into a virtual pulled set. Ramos et al. - data from [3]. Sample identification: peptides identified for a particular dilution were used. All identifications: all the peptides identified in [3] were used, regardless of dilution. Selected: additional filtration (accuracy of primary ions comparison was 5 ppm, peptides with N-terminal acetylation was removed).
|
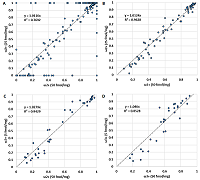
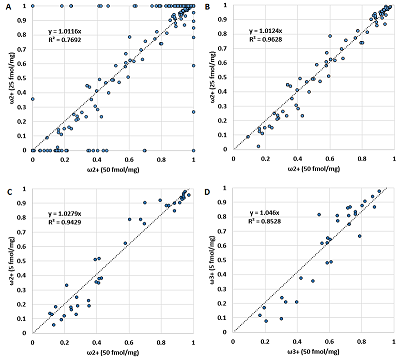
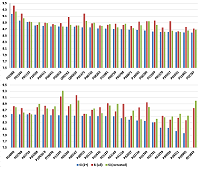
Since the charge distribution for an individual peptide is determined by its chemical nature (or amino acid sequence), it should not depend on the peptide concentration. Figure 2 demonstrates a confirmation of this postulate. As originally assumed, critical deviations can be observed when the value of ωn+ is 0 or 1. If we discard these values, the correlation becomes more than convincing (Table 1). The values of Cn/m also do not change from dilution to dilution (Fig. 3, Table 1). In the latter case, values for peptides corresponding to ωn+ equal to 0 or 1 were absent by definition. Thus, the data for the values ωn+ and Cn/m can be combined into one sample. Since the most complete sample exists for a dilution of 50 fmol/mg, it was used as a base sample, adding values if the peptide was detected only at a higher dilution or replacing values if more variants of the peptide ion were detected at a higher dilution. While the initial sample for a dilution of 50 fmol/mg had 258 observations with ω2+ values other than 0 or 1, the generalized sample had 300 such observations.
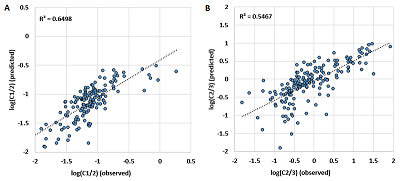
The amino acid spectrum of the peptide (the number of each of the 20 amino acid residues present in the peptide) was used as independent variables to create a set of equations that can be used to predict the charge distribution of the ions. The paper considers linear regression equations. This is not the optimal choice for this case because using linear regression cannot take into account the fact that the quantitative fractions are related and give a total of one, and that no boundary conditions are generally introduced that the predicted value can only take values from 0 to 1. However, linear equations can be used to demonstrate that such prediction is possible in principle. The results are shown in Figure 4 and Table 1. It can be seen that linear regression gives satisfactory results in all cases where the number of observations is sufficient. The best result is shown for the value of Cn/m, especially in the case of C1/2. The greater scatter for C2/3 is probably due to the fact that the presence of ions with charge more than 3+ was not taken into account, while for C1/2 most of the observations have the maximum possible charge 2+.
|
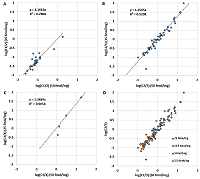
Figure 2.
Examples of comparison of the of peptide ion fraction of a particular charge (ωn+) obtained for different dilutions. Variant A includes peptides with the ωn+ value in these dilutions equal to 1 (only one variant of the ion is detected) or 0 (an ion with this charge has not been registered). Others – at least 2 fractions exist.
|
|
Figure 3.
The comparison of the ratios between the sums of intensities of differently charged ions (Сn/m) obtained for different dilutions. Сn/m values did not change from dilution to dilution.
|
|
CLOSE
|
Table 1.
The parameters of linear regression equations that predict the values of ωn+ and log(Сn/m) obtained during learning and in the leave-one-out procedure
|
|
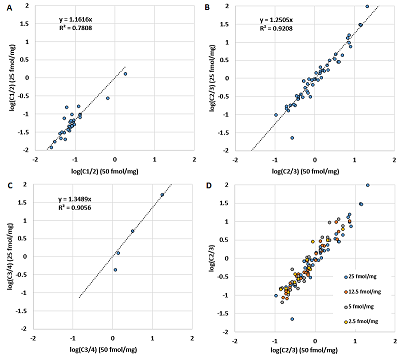
Figure 4.
The comparison of observed and predicted Cn/m values in learning procedure. The linear regression equation used the amino acid composition of peptides as independent variables.
|
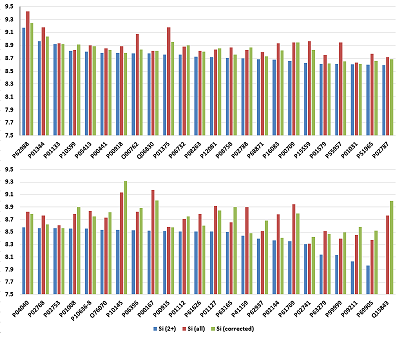
The usefulness of this kind of prediction can be illustrated by a dilution of 50 fmol/mg as an example. Figure 5 shows the averaged Si for each of the 48 proteins in the UPS1 set. In the first case, only 2+ ions observed in the experiment were taken into account. The scatter of the Si value is within 1.21 on the logarithmic scale, and for one of the proteins (48) no 2+ ions were registered. Recall that the number of each protein in the UPS1 set is the same, and averaging for each was performed, with few exceptions, for four or more peptides (28 at most), which should level out possible differences associated with trypsinolysis efficiency. The expected result would have been an approximate equality of Si values. If the sums of Si for all registered ions are taken into account, the scatter slightly decreases to 1.12 on the logarithmic scale. However, if a correction is made using the prediction of the C1/2 and C2/3 values for the observations in which only 2+ ions were detected and the C2/3 value when only 3+ ions were detected, the scatter decreases to 0.9 on the logarithmic scale. These peptides were not known to be used in the training sample, and, again, linear regression is not the best method for this problem. Nevertheless, even using very simple approach, it is possible to predict a volume of fraction of the peptide per ion of a given charge at ESI.
|
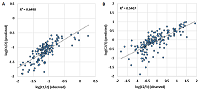
Figure 5.
The comparison of observed and predicted Cn/m values in learning procedure. The linear regression equation used the amino acid composition of peptides as independent variables.
|
FUNDING
This work was performed within the framework of the Program for Basic Research of State Academies of Sciences for 2013-2020.
SUPPLEMENTARY
Supplementary materials are available at http://dx.doi.org/10.18097/BMCRM00100
REFERENCES
- Yates, J. R., Ruse, C. I., & Nakorchevsky, A. (2009). Proteomics by mass spectrometry: approaches, advances, and applications. Annual review of biomedical engineering, 11, 49-79. DOI
- Iavarone, A. T., Jurchen, J. C., & Williams, E. R. (2000). Effects of solvent on the maximum charge state and charge state distribution of protein ions produced by electrospray ionization. Journal of the American Society for Mass Spectrometry, 11(11), 976-985. DOI
- Ramus, C., Hovasse, A., Marcellin, M., Hesse, A. M., Mouton-Barbosa, E., Bouyssié, D., ... & Garin, J. (2016). Spiked proteomic standard dataset for testing label-free quantitative software and statistical methods. Data in brief, 6, 286-294. DOI
- https://www.ebi.ac.uk/pride, Submission Reference: PXD001819.
- Cox, J., & Mann, M. (2008). MaxQuant enables high peptide identification rates, individualized ppb-range mass accuracies and proteome-wide protein quantification. Nature biotechnology, 26(12), 1367. DOI
- Cox, J., Neuhauser, N., Michalski, A., Scheltema, R. A., Olsen, J. V., & Mann, M. (2011). Andromeda: a peptide search engine integrated into the MaxQuant environment. Journal of proteome research, 10(4), 1794-1805. DOI
- Teleman, J., Chawade, A., Sandin, M., Levander, F., & Malmström, J. (2016). Dinosaur: a refined open-source peptide MS feature detector. Journal of proteome research, 15(7), 2143-2151. DOI