Pipeline of Mass-Spectrometry Data Processing for Diagnostic Molecular Marker Panel Obtaining Using the Example of Search Markers of Breast Cancer Metastasis
1Skolkovo Institute of Science and Technology, bld. 1 30 Bolshoy Boulevard,
Moscow, 121205, Russia; *e-mail: e.nikolaev@skoltech.ru.
2V.L. Talrose Institute for Energy Problems of Chemical Physics, N.N. Semenov Federal Center of Chemical Physic, Russian Academy of Sciences, bld. 2 38 Leninsky avenue, Moscow, 119334 Russia
3Academician V.I. Kulakov National Medical Research Center for Obstetrics, Gynecology and Perinatology, 4 bld. 2 Oparina str., Moscow, 117513 Russia
Keywords:mass-spectrometry; data processing; biological markers
DOI:10.18097/BMCRM00156
29 conjugates of methylene blue and four chemical structures, including derivatives of carbazole, tetrahydrocarbazole, substituted indoles and γ-carboline, combined with a 1-oxopropylene spacer have been studied as channel blockers of the NMDA receptor (binding site of MK-801) by using four QSAR methods (multiple linear regression, random forest, support vector machine, Gaussian process) and molecular docking. QSAR models have satisfactory characteristics. The analysis of regression models at the statistical level revealed an important role of the hydrogen bond in the complex formation. This was also confirmed by the study of modeled by docking complexes. It was found that the increase in the inhibitory activity of the part of compounds could be attributed to appearance of additional H bonds between the ligands and the receptor.
|
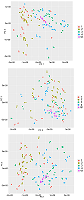
Figure 1.
Distribution of unnormalized biological samples in three principal component space. Group 1 – health tissue samples from patients without metastasis, group 2 – health tissue samples from patients with metastasis, group 3 – malignant tissue samples from patients without metastasis, group 4 – malignant tissue samples from patients with metastasis, group qc – group control quality samples.
|
|
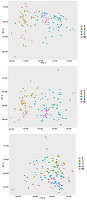
Figure 2.
Distribution of biological samples after autoscaling in three principal component space. Group 1 – health tissue samples from patients without metastasis, group 2 – health tissue samples from patients with metastasis, group 3 – malignant tissue samples from patients without metastasis, group 4 – malignant tissue samples from patients with metastasis, group qc – group control quality samples.
|
|
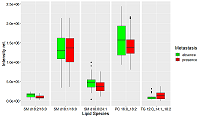
Figure 3.
Boxplot of lipids – markers of regional metastasis in breast tumor tissue. Green boxes illustrated relative levels of lipids in case of absence metastasis, red boxes – in cases of available of metastasis.
|
|
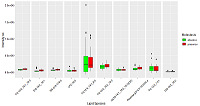
Figure 4.
Boxplot of lipids – markers of regional metastasis in breast health tissue in case of breast cancer. Green boxes illustrated relative levels of lipids in case of absence metastasis, red boxes – in cases of available of metastasis.
|
|
CLOSE
|
Table 1.
Lipids-markers coefficients β in logistic regression in case of tumor tissue, their confidence interval (CI β), Wald criterion and probability different from zero.
|
|
CLOSE
|
Table 2.
. Lipids-markers coefficients β in logistic regression in case of health tissue, their confidence interval (CI β), Wald criterion and probability different from zero.
|
FUNDING
This work was performed within the framework of the Megagrant of Ministry of Science and Higher Education of the Russian Federation (Agreement with Skolkovo Institute of Science and Technology, № 075-10-2019-083, December 11, 2019)
REFERENCES
- Podo, F., Canevari, S., Canese, R., Pisanu, M.E., Ricci, A., Iorio, E. (2011) Tumour Phospholipid Metabolism. Exp. Oncol. 19, 1–10.
- Wong, M.W., Braidy, N., Poljak, A., Pickford, R., Thambisetty, M., Sachdev, P.S. (2017) Dysregulation of lipids in Alzheimer’s disease and their role as potential biomarkers. Alzheimer’s Dement. 13(7), 810–27, DOI
- Liu, X., Li, J., Zheng, P., Zhao, X., Zhou, C., Hu, C., Hou, X., Wang, H., Xie, P., Xu, G. (2016) Plasma lipidomics reveals potential lipid markers of major depressive disorder. Anal. Bioanal. Chem. 408(23), 6497–507, DOI
- Anand, S., Barnes, J.M., Young, S.A., Garcia, D.M., Tolley, H.D., Kauwe, J.S.K., Graves, S.W. (2017) Discovery and Confirmation of Diagnostic Serum Lipid Biomarkers for Alzheimer’s Disease Using Direct Infusion Mass Spectrometry. J. Alzheimer’s Dis. 59(1), 277–90, DOI
- Hogan, S.R., Phan, J.H., Alvarado-Velez, M., Wang, M.D., Bellamkonda, R. V., Fernández, F.M., Laplaca, M.C. (2018) Discovery of Lipidome Alterations Following Traumatic Brain Injury via High-Resolution Metabolomics. J. Proteome Res. 17(6), 2131–43, DOI
- Folch, J., Lees, M., Sloane Stanley, G.H. (1957) A simple method for the isolation and purification of total lipides from animal tissues. J. Biol. Chem. 226(1), 497–509.
- Koelmel, J.P., Kroeger, N.M., Ulmer, C.Z., Bowden, J.A., Patterson, R.E., Cochran, J.A., Beecher, C.W.W., Garrett, T.J., Yost, R.A. (2017) LipidMatch: An automated workflow for rule-based lipid identification using untargeted high-resolution tandem mass spectrometry data. BMC Bioinformatics 18(1), 1–11, DOI
- Pluskal, T., Castillo, S., Villar-Briones, A., Orešič, M. (2010) MZmine 2: Modular framework for processing, visualizing, and analyzing mass spectrometry-based molecular profile data. BMC Bioinformatics 11, DOI
- Sud, M., Fahy, E., Cotter, D., Brown, A., Dennis, E.A., Glass, C.K., Merrill, A.H., Murphy, R.C., Raetz, C.R.H., Russell, D.W., Subramaniam, S. (2007) LMSD: LIPID MAPS structure database. Nucleic Acids Res. 35(SUPPL. 1), 527–32,
- Wold, S., Sjöström, M., Eriksson, L. (2001) PLS-regression: a basic tool of chemometrics. Chemom. Intell. Lab. Syst. 58(2), 109–30, DOI
- Galindo-Prieto, B., Eriksson, L., Trygg, J. (2015) Variable influence on projection (VIP) for OPLS models and its applicability in multivariate time series analysis. Chemom. Intell. Lab. Syst. 146, 297–304, DOI
- Akaike, H. (1998) Information Theory and an Extension of the Maximum Likelihood Principle. Sel. Pap. Hirotugu Akaike, 199–213, DOI
- Roy, J., Dibaeinia, P., Fan, T.M., Sinha, S., Das, A. (2019) Global analysis of osteosarcoma lipidomes reveal altered lipid profiles in metastatic versus nonmetastatic cells. J. Lipid Res. 60(2), 375–87, DOI
- Peng, W., Tan, S., Xu, Y., Wang, L., Qiu, D., Cheng, C., Lin, Y., Liu, C., Li, Z., Li, Y., Zhao, Y., Li, Q. (2018) LC-MS/MS metabolome analysis detects the changes in the lipid metabolic profiles of dMMR and pMMR cells. Oncol. Rep. 40(2), 1026–34, DOI
- Garrett, R.H., Grisham, C.. (2016) Biochemistry. 6th ed., CENGAGE Learning.
- Fagone, P., Jackowski, S. (2013) Phosphatidylcholine and the CDP-choline cycle. Biochim. Biophys. Acta - Mol. Cell Biol. Lipids 1831(3), 523–32, DOI