|
Standardization of Recombinant CRISPR/Cas13А-nuclease Preparations by Using RNase A of Known Activity Institute of Biomedical Chemistry, 10 Pogodinskaya str., Moscow, 119121 Russia; *e-mail: radkos@yandex.ru Key words: Cas13a nuclease; specific activity; standardization; RNase A DOI: 10.18097/BMCRM00177 INTRODUCTION
Currently, DNA diagnostics of infectious agents is based primarily on the use of the polymerase chain reaction (PCR) method and commonly performed in specialized laboratories. Along with the growing spread of PCR-based diagnostics of infectious diseases, during the last decade, approaches allowing DNA diagnostics to be performed outside specialized laboratories – in “in-field” or “point-of-care” settings – have been attracting the increasing attention [1, 2]. The approaches heavily rely on methods of isothermal amplification of nucleic acids. Unlike PCR, isothermal amplification requires no use of specialized equipment, while reactions can proceed at a constant (37-65°C) or even room temperature [3]. For isothermal amplification, a composition of enzymes and specialized proteins is used providing an exponential increase in the number of copies of a target sequence (107-1010-fold within 30-60 minutes) [3]. A drawback of the isothermal amplification methods is that, in general, their selectivity is lower compared to PCR due to the generation of unspecific amplification products [6]. A promising way to overcome this drawback is to combine isothermal amplification with a CRISPR/Cas-based detection of amplification products [4, 5]. CRISPR/Cas-nucleases are able to form complexes with RNA molecules of specific sequences – the so-called “guide RNA” (gRNA), composed of a part responsible for interaction with a Cas-nuclease (“repeat”) and a part (“spacer”) which is complementary to a region in a target sequence (“protospacer”) [7]. The Cas-nuclease activates only if a heteroduplex between spacer and protospacer is formed that results in the nicking of a target sequence. Upon activation, some types of Cas-nucleases can acquire collateral activity which is an ability to unselectively cleave RNA or single-stranded DNA (ssDNA) molecules present around. That allows to significantly enhance both selectivity and sensitivity of in vitro detection of the target DNA amplicons (or their RNA replicas generated with T7 RNA-polymerase using DNA amplicons as a template) bearing the protospacer sequence, by using gRNA/Cas complexes and “reporters” – appropriately labeled RNA or ssDNA molecules added to a test tube [8]. Presently, two CRISPR/Cas-nucleases, viz. Cas12a and Cas13a, are suggested for selectively recognizing target amplicons generated by isothermal amplification of a target sequence [9]. Among them, Cas13a is a CRISPR/Cas-ribonuclease with a collateral activity towards RNA molecules [9]. The development of DNA diagnostics based on the use of recombinant Cas13a-nuclease [5, 10] would definitely benefit from standardization of Cas13a-ribonuclease preparations preparations in regard to its collateral activity. We have recently reported on a robust, single stage method for purification of Cas13a-nuclease via metal-chelating chromatography after its heterologous expression [11]. In this work, we demonstrate that, by using commercial RNase A with known ribonuclease activity, the collateral activity of recombinant Cas13a-nuclease can be determined in terms of specific activity. The knowledge of specific collateral activity of Cas13a-nuclease preparations can allow for a correct nuclease dosage when developing and producing relevant assays, as well as for monitoring the outcome of the nuclease expression and purification upon their optimization. MATERIALS AND METHODS Reagents All chemicals purchased from “Sigma-Aldrich” (USA) were of the ACS grade unless otherwise stated. Solutions were prepared using Milli-Q quality water (18 MΩ·cm). The recombinant Cas13a-nuclease was expressed and purified as described in details elsewhere [11]. The protein concentration was measured with the Bradford assay (“Bio-Rad”, USA) and bovine serum albumin as a standard. To calculate the molar concentration of Cas13a-nuclease, the protein molecular weight was taken as 138 kDa. The Cas13a preparations were stored in 600 mM NaCl, 50 mM Tris-HCl, pH 7.5, 5% glycerol, 2 mM dithiothreitol (storage buffer) at -80°C until use. The DNA oligonucleotides (Table 1) were chemically synthesized by “Evrogen” (Russia) and used as received. Guide RNA, synthetic RNA target, and E. coli total RNA The sequences of candidate gRNA were selected using the web application CRISPR-RT [12]. The gRNA spacer was designed to recognize a region of E. coli 16S rRNA. When selecting the spacer sequence, various regions of E. coli 16S rRNA were analyzed with the DNA structure prediction software OligoAnalyzer (https://eu.idtdna.com/calc/analyzer) to ensure that no secondary structures were formed both within the spacer and between the spacer and the gRNA repeat. To synthesize gRNA, the DNA oligonucleotide D8R containing the sequence complimentary to that of the promoter of T7 RNA-polymerase (T7-promotor) was employed as a template (Table 1). The DNA template and the oligonucleotide with the T7-promoter sequence (5’-TAATACGACTCACTATAGGG-3’) were equimolarly mixed and annealed by incubating the mixture at 95°C for 2 min, followed by cooling down to room temperature. The gRNA was synthesized by using a TranscriptAid T7 High Yield Transcription Kit (“Thermo Fisher Scientific”, USA) in accordance with the manufacturer instructions and purified with phenol/chloroform extraction and ethanol precipitation. The RNA pellet was dissolved in nuclease-free water, RNA concentration was measured on a NanoDrop 1000 spectrophotometer (“Thermo Fisher Scientific”), and RNA was analyzed by denaturing gel electrophoresis. The synthetic RNA target (sRNA) representing the 60-nucleotide-long region of E. coli 16S rRNA and bearing 28-nucleotide-long sequence complimentary to the gRNA spacer was synthesized, purified, and characterized analogously, except for using DNA oligonucleotide D8T as a template (Table 1).
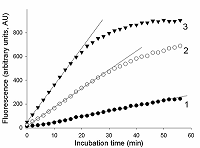
The total RNA (tRNA) was isolated from the XL1 E. coli Blue strain with ExtractRNA reagent (“Evrogen”, Russia) according to the manufacturer’s protocol. RNA was dissolved in nuclease-free water and its concentration was determined on a NanoDrop 1000 spectrophotometer. Aliquots of gRNA, sRNA, and tRNA preparations were stored at -80°C until use. Measurement of the rate of RNA cleavage by RNase A and Cas13a ribonucleases To measure the rate of RNA cleavage by ribonucleases, we used a RNaseAlert® Lab Test Kit v2 (“Thermo Fisher Scientific”) destined for detecting the ribonuclease activity. The kit includes reporters which are short RNA molecules labelled with a fluorescent dye (presumably fluorescein) and a quencher (further referred to as FQ-reporters). Upon cleavage of the FQ-reporter, the fluorophore and the quencher separate that results in an increase of fluorescence. Besides, the kit is supplied with a sample of RNase A with ribonuclease activity of 0.03 U/mL as provided by the manufacturer. The measurements were performed following the recommendations from the kit’s manufacture. FQ-reporters were dissolved in 10X RNaseAlert Lab Test Buffer and the solution was diluted 10-fold with nuclease-free water (the stock solution). The stock solution of FQ-reporters in 1X RNaseAlert Lab Test Buffer was stored on ice in the dark till further use. RNase A was serially diluted with TE-buffer to obtained solutions with desirable ribonuclease activities. 1 µL of each of those solutions was brought to a volume of 45 µL with 1X RNaseAlert Lab Test Buffer and mixed with 5 µL of the FQ-reporter stock solution. The obtained samples were placed into wells of a 95-well microplate and fluorescence was monitored at 37°C on a TECAN Infinite 200 Pro plate reader (“TECAN”, Austria) for 1 h, using wavelengths of 490 and 520 nm for excitation and emission, respectively. The fluorescence was corrected by subtracting the fluorescence of control samples (contained no ribonuclease) at each time point. In the case of Cas13a nuclease, the gRNA/Cas13a complexes were preliminary formed. The Cas13a-nuclease and gRNA were diluted to desired concentrations with 40 мМ Tris-HCl (pH 7.3), 60 мМ NaCl, 6 мМ MgCl2 (hereinafter referred to as buffer R) and mixed at different molar ratios (1 to 16). The mixtures were adjusted to a volume of 35 µL with buffer R, supplemented with Murine RNase Inhibitor (“New England Biolabs”, USA) so to provide the final inhibitor concentration of 1.4 unit/µL, and incubated at 37°C for 15 min. Afterwards, 5 µL of the stock FQ-reporter solution and a required amount of either sRNA or tRNA were added to each sample. The final volume of the samples was 50 µL. All solutions were stored on ice during manipulations. Samples were transferred to wells of a 95-well microplate and fluorescence was read and treated as described above. The control samples contained no gRNA/Cas13a complexes. RESULTS AND DISCUSSION As well known, enzyme preparations differ by both their purity and the relative amount of the enzyme in its active form that results in variations of their specific activity expressed as the number of activity units per milligram of protein (U/mg). As a rule, the enzyme activity is determined by measuring either time-depended accumulation of a reaction product or utilization of a substrate. Since the rate of the enzymatic reaction, V, for a given enzyme activity depends on substrate concentration, in practice, the initial reaction rate (V0) is measured to determine enzyme activity thus suggesting that there is an excess of a substrate [13, 14]. To ensure the excess of substrate, a series of enzyme concentrations has to be tested. The initial rate can be determined by the “tangent method” or from the slope of the kinetic curve provided that the curve has a linear portion at its very beginning [13, 14]. The enzyme activity refers to particular conditions, such as stipulated temperature as well as composition (pH, the ionic strength, etc.) of the reaction medium, which for a giving enzyme are considered as standard. As an alternative to the measuring of enzymatic reaction outcome in terms of the absolute amount of a reaction product, the initial reaction rate of the enzyme with unknown activity can be compared with that of the enzyme of known activity. In such case, a proxy of the reaction product (e.g., a relative fluorescence, absorbance, etc.) could be measured thus offering a substantial technical simplification. In this work, we have used RNaseAlert® Lab Test Kit v2 which is designed for determining ribonuclease activity by monitoring fluorescence changes. First, we analyzed the kinetics of the FQ-reporter cleavage in samples with known activity of RNase A. In Fig. 1, the typical kinetic curves are presented. As seen, there is an initial linear region on each curve, the slope of which can be taken as the V0 value (in arbitrary units of fluorescence per minute, AU/min).
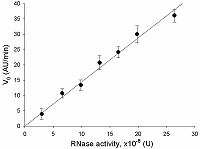
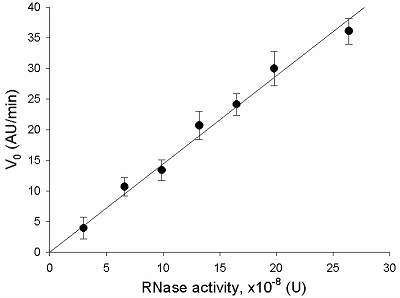
The V0 values were used to plot the dependence of V0 on the amount of RNase A activity in a sample, which is shown in Fig. 2. The initial rate appears to be directly proportional to the amount of RNase activity in the tested interval, from 0 to about 25·10-8 U. This suggests that the substrate, FQ-reporters, is present in the excess at the beginning of the incubation. The dependence may be described by a linear regression equation:
where A – ribonuclease activity (U), k – proportionality coefficient equal to 1.4·108 (AU/min·U).
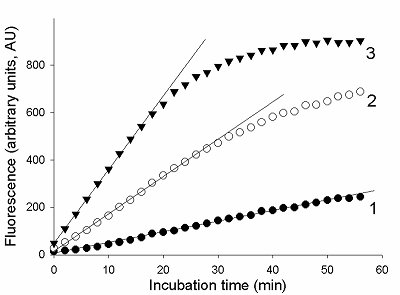
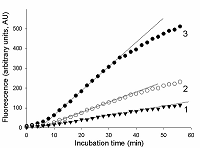
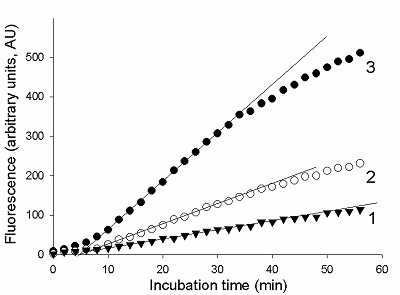
To determine the initial rate of FQ-reporter cleavage by Cas13a-nuclease, FQ-reporters and sRNA (the target) were added to the preformed gRNA/Cas13a complexes. The examples of typical kinetic curves are presented in Fig. 3. No appreciable differences were observed between control samples (containing no gRNA/Cas13a complexes) and samples containing Cas13a complexes but lacking either gRNA or sRNA (data not shown). As seen, there is a delay of about 5 min in the fluorescence increase after that as the microplate with samples were placed into the reader and the measurements were started. Such delay was not observed in the case of RNase A (Fig. 2). A possible reason behind it may be a difference in temperature dependences for ribonuclease activities of RNase A and Cas13a. The TECAN Infinite 200 Pro instrument used in this study begins to adjust temperature to that set (37°C) only after the measurement has started while the microplate with samples was kept on ice prior to being placed into the fluorimeter. It is thought that the collateral ribonuclease activity of Cas13a may have a much stronger temperature dependence than the RNase A ribonuclease activity. Nonetheless, one can distinguish linear regions on the kinetic curves (Fig. 3), which may be used to calculate V0 values for Cas13a-nuclease.
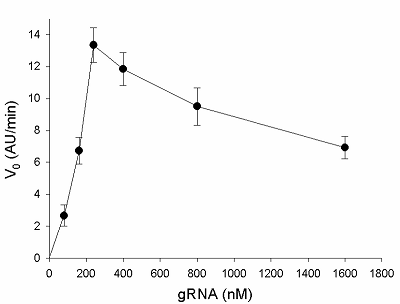
The formation of gRNA/Cas13a complexes is a prerequisite for the acquiring of collateral activity by Cas13a-nuclease. Since the efficiency of complex formation can depend on a ratio of gRNA to Cas13a, the V0 values were determined at various gRNA/Cas13a molar ratios (1 to 16). The corresponding sequence of 16S rRNA as a part of E. coli total RNA added to samples served as a target. The results are presented in Fig. 4: the initial rate, V0, raises with the gRNA concentration, achieving the maximum at the gRNA/Cas13a molar ratios of 3-4 and slow decreasing after that. The decrease can reflect an interference of total RNA with the stability of gRNA/Cas13a complexes. Alternatively, due to the limited activity of Cas13a-nuclease at a given concentration, the growth of the number of unlabeled gRNA molecules (which are not in the complex with the nuclease) in the reaction mixture can lead to a reduction in a cleavage of labelled (FQ-reporters) substrate that is manifested as the “apparent” decrease of Cas13a collateral activity with the gRNA concentration (Fig. 4). In any case, the results presented in Fig. 4 demonstrate that gRNA/Cas13a molar ratios of 3 to 4 appear to be the most optimal for the formation of active gRNA/Cas13a complexes.
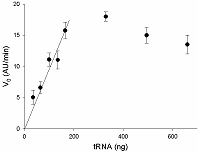
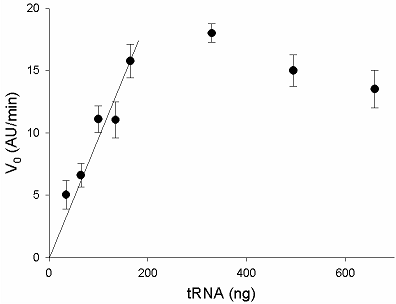
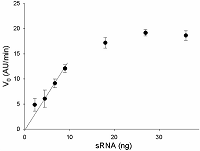
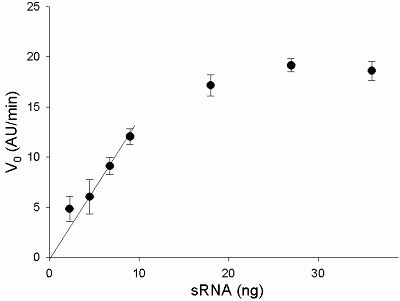
Another parameter requiring the optimization is the number of target molecules in the sample. To this end, we determined V0 values as the function of the target amount at the gRNA/Cas13a molar ratio of 4. As a target, tRNA containing 16S rRNA was used. As seen in Fig. 5, the V0 values increased in a linear fashion with the tRNA concentration up to about 200 ng, At the tRNA concentrations above 200 ng, some decrease of V0 values was observed analogous to that seen with the increase in gRNA concentration in Fig. 4. When sRNA was used instead of tRNA as the target, no such decrease was detected (Fig. 6). This observation reinforces our speculation: the slow decreases in V0 values (after reaching the maximum) with gRNA or tRNA concentrations (Figs. 4 and 5) do relate to the growth in the number of unlabeled RNA molecules (whose cleavage is invisible to us), which is manifested as an “apparent” decline of the Cas13a collateral activity. As one may conclude by comparing Figs. 5 and 6, the use of sRNA as the target is more useful than that of tRNA. At the gRNA/Cas13a molar ratio of 4, the addition of about 30 ng of sRNA to the sample provides the maximal activation of Cas13a-nuclease.
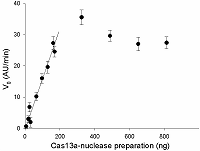
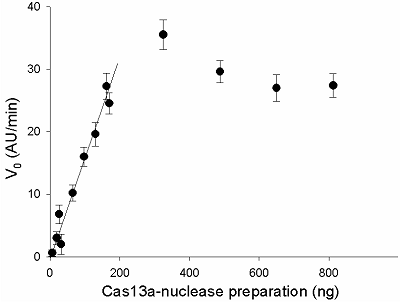
In order to determine the range, where the initial rate of FQ-reporter cleavage depends on the concentration of gRNA/Cas13a complexes in a linear fashion, the gRNA/Cas13a molar ratio of 4 and the presence of 30 ng of sRNA in a sample were taken as the optimal. The amount of the preformed gRNA/Cas13a complexes, expressed as the amount of Cas13a in the sample, varied from 7 to 800 ng. The results obtained are shown in Fig. 7: the V0 values raise practically linear in the range of 0 to 200 ng of Cas13a, followed by a plateau.
Three values of V0 from the linear portion of the curve in Fig. 7 were used to calculate the specific collateral activity of Cas13a-nuclease by the following equation:
where acas – specific activity in units activity per milligram of protein (U/mg), k – coefficient proportionality in the Equ. 1 (1,4·108 AU/min·U), m – the protein amount in a sample (mg). For the amounts of protein of 0.01 mg, 0.015 mg, and 0.02 mg, the corresponding V0 values were 10.2 AU/min, 16.0 AU/min, and 19.6 AU/min (Fig. 7) and the acas values were calculated as 7.3·10-6 U/mg, 7.6·10-6 U/mg, and 7.0·10-6 U/mg. Thus, the specific collateral activity of the given Cas13a preparation taken as a mean of the calculated values equals 7.3·10-6 U/mg.
CONCLUSIONS To sum up, the suggested approach demonstrates that the specific collateral activity of the recombinant Cas13a-nuclease preparations can be determined using commercial RNase A of known activity. The approach requires detection of an optimal molar ratio for a formation of gRNA and Cas13a complex formation as well as the optimal amount of the RNA target. The use of a synthetic RNA target appears preferable as compared with native RNA preparations. The characterization of Cas13a preparations in terms of specific collateral activity may allow one to standardize the preparations. The standardization of Cas13a preparations may benefit both the development of assays employing Cas13a collateral ribonuclease activity and the optimization of the ribonuclease expression, purification, and storage. COMPLIANCE WITH ETHICAL STANDARDS This article does not contain any research involving humans or using animals as objects. FUNDING This study was supported by the Ministry of Science and Higher Education of the Russian Federation within the framework of the Federal Scientific and Technical Program for the Development of Genetic Technologies for 2019-2027 (agreement №075-15-2021-1345, unique identifier RF-193021X0012). CONFLICT OF INTEREST The authors declare no conflict of interest. Supplementary materials are available at http://dx.doi.org/10.18097/BMCRM00177 REFERENCES
|