Proteoform Identification in 2D Electrophoresis Maps by Using Isoelectric Point Prediction
Institute of Biomedical Chemistry, Pogodinskaya Street, 10, Moscow 119121, Russia; *e-mail: aleona.rybina@ibmc.msk.ru
Keywords: isoelectric point; 2D electrophoresis; proteform analysis
DOI:10.18097/BMCRM00191
The possibility of identifying specific protein proteoforms with post-translational modifications (PTM) by analyzing two-dimensional (2D) gel electrophoresis maps and using the prediction of the isoelectric point of proteins (pI) has been investigated. The pI values were predicted using the pIPredict 3 program, supporting a wide range of chemical and post-translational modifications. Eleven 11 proteins (albumin, alpha-1-microglobulin, annexin A2, apolipoprotein E, gastric triacylglycerol lipase, mitochondrial isocitrate dehydrogenase, clusterin, plasmin, prothrombin, endoplasmic reticulum chaperone, S-adenosylmethionine synthase type 1) identified on six 2D electrophoresis maps were used as examples. Various options for selecting hypotheses are considered. These take into consideration the following available information about a particular protein: possible modification sites, processing features, variability of the amino acid composition. The obtained results indicate that the use of predicting the pI value for proteins with hypothetical PTMs can form a set of hypotheses about specific proteoform occurrence on 2D electrophoresis maps.
|
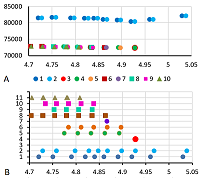
Figure 1.
An example of data transformation for clarity of perception. A. Actual distribution of pI and MW values obtained for the P06761 protein of map 4. B. The comparison diagram transformed by pI values. Here and in below, the following legend is used: Current position of points on the map (row 1); Alignment of points according to the putative unmodified proteoform (row 2); Alignment of points according to the best match of pI values (row 3); Prediction of pI values for proteins with different numbers (from 1 to maximum) of phosphorylated residues (row 5), acetylation sites (row 6), and succinylation sites (row 7); Combination of acetylation and phosphorylation (from 1 to maximum) (row 8); Combination of succinylation and phosphorylation (from 1 to maximum) (row 9); Combination of acetylation, succinylation and phosphorylation (from 1 to maximum) (row 10); Average values for multiples of phosphorylated residues from 1 to 15 (row 11).
|
|
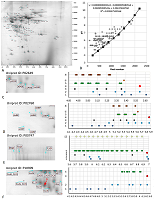
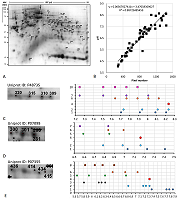
Figure 2.
Results of map 1 analysis. A. Photo of the map published in the article [11]. B. Comparison of pixel coordinates (abscissa) and pI values (according to the labels shown in the photo; ordinate) and the recalculation equation. The proteins and proteoforms identified in the study are shown in grey. C-F. Analysis of proteoforms of identified proteins. On the left is a fragment of a photograph of the map with analyzed proteoforms.
|
|
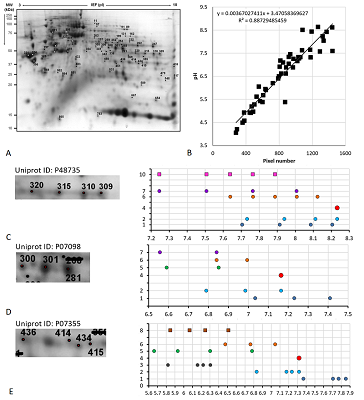
Figure 3.
Results of map 2 analysis. A. Photo of the map published in the article [13]. B. Comparison of pixel coordinates (abscissa) and predicted pI values (ordinate) of identified proteins (in the presence of several proteoforms, only the most basic form was taken into account) and the correlation equation used to recalculate the pI values from the coordinates. C-E. Analysis of proteoforms of identified proteins. On the left is a fragment of a photograph of the map with analyzed proteoforms.
|

|
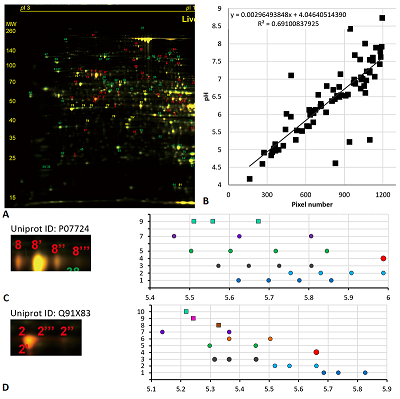
Figure 4.
Results of map 3 analysis. A. Photo of the map published in the article [14]. B. Comparison of pixel coordinates (abscissa) and predicted pI values (y-axis) of identified proteins (in the presence of several proteoforms, only the most basic form was taken into account) and the correlation equation used to recalculate the pI values from the coordinates. C-D. Analysis of proteoforms of identified proteins. On the left is a fragment of a photograph of the map with analyzed proteoforms.
|

|
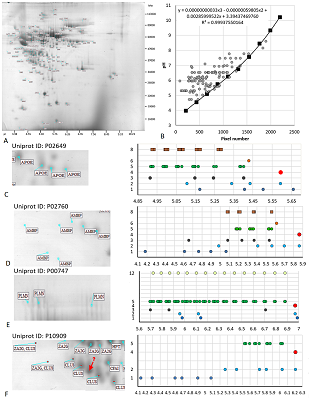
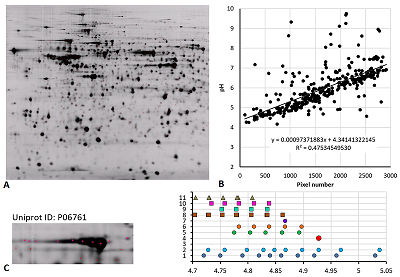
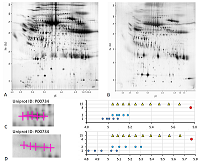
Figure 5.
Results of map 4 analysis. A. Photo of the map published in the article [15].B. Comparison of pixel coordinates (abscissa) and predicted pI values (ordinate) of identified proteins. C. Proteoform analysis of the P06761 protein. On the left is a fragment of a photograph of the map with analyzed proteoforms.
|

|
FUNDING
The work was performed within the framework of the Program for Basic Research in the Russian Federation for a long-term period (2021-2030) (№122030100170-5).
REFERENCES
- Knorre, D.G., Kudryashova, N.V., Godovikova, T.S. (2009) Chemical and functional aspects of posttranslational modification of proteins. Acta Naturae, 1(3), 29-51. DOI
- Kiseleva, O.I., Lisitsa, A.V., Poverennaya, E.V. (2018) Proteoforms: methods of analysis and clinical prospects. Molecular Biology, 52(3), 335-349. DOI
- Naryzhny, S.N., Legina, O.K. (2019) Structural-functional diversity of p53 proteoforms. Biomeditsinskaya Khimiya, 65(4), 263-276. DOI
- Rabilloud, T., Charmont, S. (2000) Detection of proteins on two-dimensional electrophoresis gels. in proteome research: two-dimensional gel electrophoresis and identification methods. Principles and practice (T. Rabilloud eds), Springer, Berlin, Heidelberg, pp. 107-126. DOI
- Skvortsov, V.S., Ivanova, Ya.O., Voronina, A.I. (2021) The bioinformatic identification of proteins with varying levels of post-translational modifications in experimental ischemic stroke in mice. Biomeditsinskaya Khimiya, 67(6), 475-484. DOI
- Skvortsov, V.S., Voronina, A.I., Ivanova, Y.O., Rybina, A.V. (2021) The prediction of the isoelectric point value of peptides and proteins with a wide range of chemical modifications. Biomedical Chemistry: Research and Methods, 4(4), e00161. DOI
- Po, H.N., Senozan, N.M. (2001) The Henderson- Hasselbalch equation: its history and limitations. Journal of Chemical Education, 78, 1499-1503. DOI
- Halligan, B.D., Ruotti, V., Jin, W., Laffoon, S., Twigger, S.N., Dratz, E.A. (2004) ProMoST (protein modification screening tool): a web-based tool for mapping protein modifications on two-dimensional gels. Nucleic Acids Research, 32(suppl_2), W638-W644. DOI
- Frolov, A.I., Chankeshwara, S.V., Abdulkarim, Z., Ghiandoni, G.M. (2023) pIChemiSt ─ free tool for the calculation of isoelectric points of modified peptides. Journal of Chemical Information and Modeling, 63(1), 187-196. DOI
- Hoogland, C., Mostaguir, K., Appel, R.D., Lisacek, F. (2008) The World-2DPAGE constellation to promote and publish gel-base d proteomics data through the ExPASy server. Journal of Proteomics, 71(2), 245-248. DOI
- Naryzhny, S., Ronzhina, N., Zorina, E., Kabachenko, F., Klopov, N., Zgoda, V. (2022) Construction of 2DE patterns of plasma proteins: aspect of potential tumor markers. International Journal of Molecular Sciences, 23(19), 11113. DOI
- The UniProt Consortium (2021) UniProt: the universal protein knowledgebase in 2021. Nucleic Acids Research, 49(D1), D480-D489. DOI
- Repetto, O., De Re, V., Giuffrida, P., Lenti, M.V., Magris, R., Venerito, M., Steffan, A., Di Sabatino, A., Cannizzaro, R. (2021) Proteomics signature of autoimmune atrophic gastritis: towards a link with gastric cancer. Gastric Cancer, 24(3), 666-679. DOI
- Kamata, S., Yamamoto, J., Ohtani, H., Tosaka, Y., Yoshikawa, S., Akahoshi, N., Ishii, I. (2018) 2D DIGE proteomic analysis reveals fasting-induced protein remodeling through organ-specific transcription factor(s) in mice. FEBS Open Bio, 8(9), 1524-1543. DOI
- D'Hertog, W., Maris, M., Thorrez, L., Waelkens, E., Overbergh, L., Mathieu, C. (2011) Two-dimensional gel proteome reference map of INS-1E cells. Proteomics, 11(7), 1365-1369. DOI
- Golaz, O., Hughes, G. J., Frutiger, S., Paquet, N., Bairoch, A., Pasquali, C., Sanchez, J. C., Tissot, J. D., Appel, R. D., Walzer, C. (1993) Plasma and red blood cell protein maps: update 1993. Electrophoresis, 14(11), 1223-1231. DOI
- Sanchez, J.C., Appel, R.D., Golaz, O., Pasquali, C., Ravier, F., Bairoch, A., Hochstrasser, D.F. (1995) Inside SWISS-2DPAGE database. Electrophoresis, 16(7), 1131-1151. DOI
- Skvortsov, V.S., Rybina, A.V. (2022) The filtration of 2D electrophoresis data during creation of a learning set for prediction of the value of the isoelectric point of proteins. Biomedical Chemistry: Research and Methods, 5(1), e00162. DOI
- Rath, A., Glibowicka, M., Nadeau, V.G., Chen, G., Deber, C.M. (2009) Detergent binding explains anomalous SDS-PAGE migration of membrane proteins. Proceedings of the National Academy of Sciences, 106(6), 1760-1765. DOI
- Sokolnikov, A.A., Kodentsova, V.M. (1999) Functional role of vitamin K. Voprosy Meditsinskoi Khimii, 45(6), 453-461.