Algorithm of targeted (SRM) methods development in mass-spectrometric studies
Institute of Biomedical Chemistry, 119121 Moscow, Pogodinskaya Str., 10 bldg. 8, *e-mail: victor.zgoda@gmail.com
Keywords: selected reaction monitoring; peptides; stable isotope labeling; mass spectrometry
DOI: 10.18097/BMCRM00006
Determination of protein concentration in biological samples is an important task for biological research, as well as for medicine and routine clinical biochemistry.
The introduction of stable isotope-labeled peptide standards (SIS) made it possible to determine accurately absolute protein concentrations in proteomic studies. The correct choice of SIS and the systematic way to develop a method for selected reaction monitoring (SRM) are very important steps that are crucial for further identification and measurements of protein concentration. In this paper, we summarize our experience of selecting SIS for measuring the protein concentration by SRM. The results are presented in the form of an algorithm that describes the main stages of the SIS selection and the main points in the development of SRM methods for the targeted protein detection and determination of protein concentrations in biological samples.

|
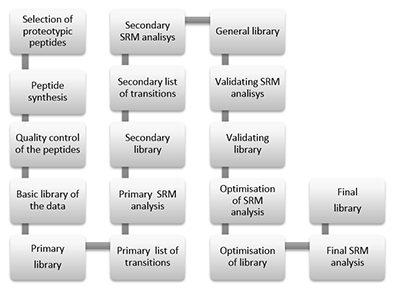
Figure 1.
General steps of peptide selection and SRM method development for proteins quantitation by SIS.
|
|
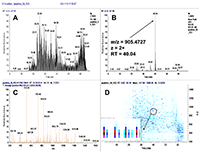
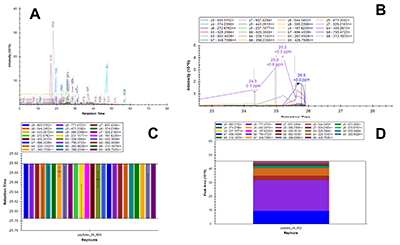
Figure 2.
Analysis of synthetic peptides by high resolution LC-MS/MS. Total ion current (TIC) chromatogram of the peptide mixture (А). Extracted ion chromatogram of the peptide ionm/z = 905.4727 and z = 2+, which corresponds to LNDTTLQVLNTWYTK peptide [sequence site from 409 to 423 of the Q6UX06 (Olfactomedin-4 OS=Homo sapiens GN=OLFM4 PE=1 SV=1)] (B). Fragment spectra of the precursor ion m/z = 905.4727 (C). Distribution of precursor ions density in a crude peptide mixture. The zoomed area which corresponds to the peptide ion of m/z 905.4727 and RT 4 min is shown in insert. (D).
|
|
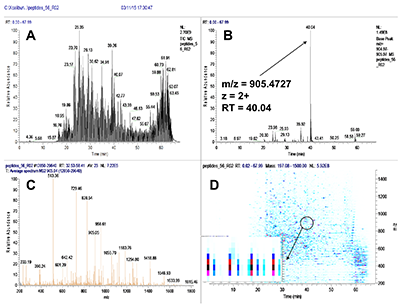
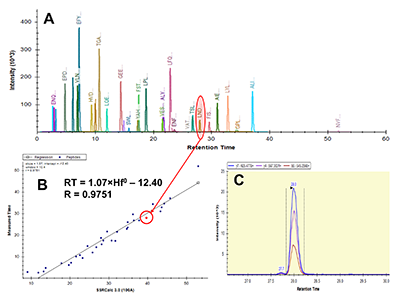
Figure 3.
Peptide mixture MS data analysis by Skyline software. Chromatograms of the peptide ions for sequences uploaded in Skyline as the FASTA format (А). An example of the peptide (LNDTTLQVLNTWYTK) ion m/z = 905.4727 chromatogram (B). Dependence of m/z = 905.4727 fragment ions intensities on retention time. The figure shows that not all fragments are co-eluted (C), so they should be excluded from the further analysis. Distribution of relative intensities of fragment ions of peptide precursor ion m/z = 905.4727 (D).
|
|
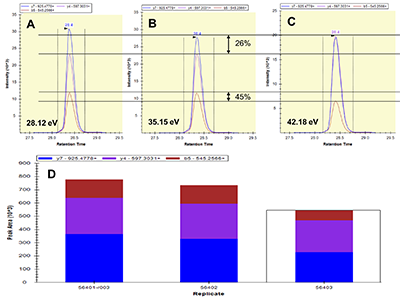
Figure 4.
Comparison of intensities of the precursor ion m/z = 905.4727 and it fragmental ions at different collision energy values. Intensity and order of the fragment ions at CE of 28.12 eV. Figure shows the following order of decreasing intensities: y7 (m/z = 925.4778), y4 (m/z = 597.3031) and b5 (m/z = 545.2566) (А). At collision energy equal to СЕ=35.15 eV we observed the same order of the fragmental ions with slightly decreased total intensity (B). At collision energy equal to СЕ=42.18 eV we observed different order of the fragmental ions with decreased intensity (C). Dependence of relative intensities of fragment ions of peptide precursor ion m/z = 905.4727 on CE (D).
|
|
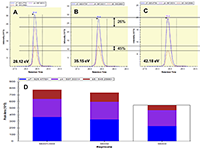
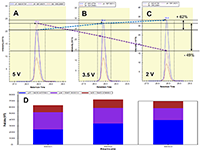
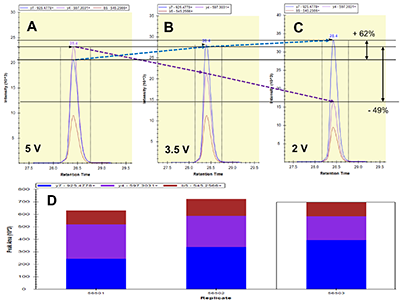
Figure 5.
Comparison of ions intensities of the precursor ion m/z = 905.4727 and it fragmental at different accelerating voltage (CAV) values. Arrows show the tracing of fragment ions y7 and y4. Intensity and order the fragment ions at CAV = 5 В. Figure shows the following order of decreasing intensities: y7 (m/z = 925.4778), y4 (m/z = 597.3031) and b5 (m/z = 545.2566) (А). At CAV equal to = 3.5 V we observe the same order of the fragmental ions with slightly decreased y4 fragment intensity (B). At CAV equal to = 2 V we observe the same order of the fragmental ions with the higher degree of decreased intensities(C). Dependence of relative intensities of fragment ions of the peptide precursor ion m/z = 905.4727 on CAV (D).
|
|
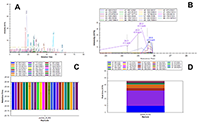
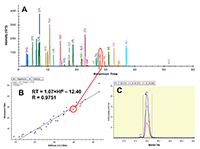
Figure 6.
Chromatogram of the peptide mixture by SRM (А). Dependence of the predicted retention time (RT) on the experimentally observed RT. The red circle slows the data point corresponding to the peptide m/z = 905.4727 (B). Chromatographic profiles of fragment ions transitions of parent ion m/z = 905.4727 according to final SRM method (C).
|
ACKNOWLEDGEMENTS
The work was supported under the auspice of the Russian Academy of Sciences research program "Fundamental Research for Biomedical Technologies" for 2018.
SUPPLEMENTARY
REFERENCES
- Aebersold, R., & Mann, M. (2016). Mass-spectrometric exploration of proteome structure and function. Nature, 537(7620), 347–355. DOI
- Chambers, A. G., Percy, A. J., Simon, R., & Borchers, C. H. (2014). MRM for the verification of cancer biomarker proteins: recent applications to human plasma and serum. Expert Review of Proteomics, 11(2), 137–148. DOI
- Wu, H.-Y., Goan, Y.-G., Chang, Y.-H., Yang, Y.-F., Chang, H.-J., Cheng, P.-N., et al. (2015). Qualification and Verification of Serological Biomarker Candidates for Lung Adenocarcinoma by Targeted Mass Spectrometry. Journal of Proteome Research, 14(8), 3039–3050. DOI
- Percy, A. J., Tamura-Wells, J., Albar, J. P., Aloria, K., Amirkhani, A., Araujo, G. D. T., et al. (2015). Inter-laboratory evaluation of instrument platforms and experimental workflows for quantitative accuracy and reproducibility assessment. EuPA Open Proteomics, 8, 6–15. DOI
- Hood, C. A., Fuentes, G., Patel, H., Page, K., Menakuru, M., & Park, J. H. (2008). Fast conventional Fmoc solid-phase peptide synthesis with HCTU. Journal of Peptide Science?: An Official Publication of the European Peptide Society, 14(1), 97–101. DOI
- Moskaleva, N., Moysa, A., Novikova, S., Tikhonova, O., Zgoda, V., & Archakov, A. (2015). Spaceflight Effects on Cytochrome P450 Content in Mouse Liver. PloS One, 10(11), e0142374. DOI