|
CONTENTS COMPLIANCE WITH ETHICAL STANDARDS |
Human Chr18: “Stakhanovite” Genes, Missing and Upe1 Proteins in Liver Tissue and Hepg2 Cells
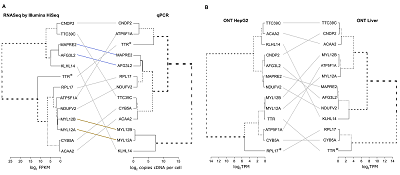
1Научно-исследовательский институт биомедицинской химии имени В. Н. Ореховича, Key words: human proteome project; C-HPP, transcriptome; Oxford Nanopore Technologies; Illumina; RNA-seq; proteotypic peptides; missing proteins DOI: 10.18097/BMCRM00144 INTRODUCTION The Chromosome-Centric Human Proteome Project (C-HPP) [1] is currently in a mature state with a rough benchmark of 85% of the human proteome covered throughout different tissue/cell types [2]. The remaining portions of the uncovered proteome are challenging because of two issues. First, there are missing proteins never detected by mass spectrometry (MS) or antibodies (Ab)-based experiments at the trustable level of confidence [3]. Second, some proteins were sometimes detected in a certain type of biospecimen, but without any clear function. Although the segregation of the unexplained proteins into two groups is obviously convenient, missing and uPE1 proteins from tissues or cells appear similar by the equally low level of mRNA expression. Moreover, according to NextProt releases, missing proteins sometimes pass into the uPE1 category, and such transfer confers the ultimate task of the current phase of C-HPP. We hypothesized, that missing and uPE1 proteins might not be so different from the viewpoint of C-HPP mass-spectrometry pillar, particularly if specific biospecimens are analyzed. For the human chromosome 18 genes (Chr18, the Russian C-HPP consortium [4]), the baseline metrics to the beginning of 2020 included 265 protein-coding genes (PE1-PE4), among which protein evidence of the level PE1 was available for 252, 13 proteins were missing and 10 had a uPE1 status. This list of 23 proteins (10 PE2, 12 PE3 and just one PE4) became our targets for the neXt-MP50 and CP50 challenges [2]. To capture highlighted targets, in this study we relied upon the new sequencing technology of the Oxford Nanopore enhanced by further targeted data mining for the missing and uPE1 proteins. The absence of some proteins could be reasonably attributed to alterations in the primary structure [5], when proteotypic peptides can accidentally fall into the splice junctions, or carry nonsynonymous polymorphisms, affecting the peptide retention time and mass-to-charge ratio in the LC–MS/MS analysis. Thus, the increased accuracy of transcriptome data became ultimately essential, despite many studies already published on the chromosome-centric transcriptome to proteome mapping, including those from our group [6, 8], from the Spanish Proteome society [9], reports on Chr9 [10] and Chr17 [11], and also the report on the transcriptome-to-translatome-to-proteome contribution from the Chinese consortium [12]. Inspired by C-HPP work tasks a corpus of bioinformatics tools [13, 14] and databases [15, 16] was developed to manage the transcriptomes. However, little attention was paid to the problem of the reliability of the underlying transcriptome data. In most cases, the transcriptome was analyzed by a single method—e.g., RNA-Seq—and at best validated by a second method—e.g., by quantitative PCR. For example, SOLiD technology was applied for the whole-transcriptome analysis of HepG2 cell lines and liver tissues [17] (these biomaterials were proposed by the Russian C-HPP Roadmap [4]) and validated by only 45 selected mRNAs by droplet digital PCR (ddPCR). Some other data included Illumina GaIIx and SOLiD profiling of Chr18 [7] but should be considered as outdated due to the novelties in the next-generation sequencing (NGS) platforms. Validating the transcriptome versus the proteome by quantitatively correlating gene product abundance [18, 19] was an attractive idea. The Chr18 consortium (Russia) investigated such an approach in detail. In capturing the transcriptome to proteome relationships researches usually rely on general arguments referring to NGS platform dependence of experiments, gene-to-gene difference in effectiveness of transcription, the rate of protein synthesis and degradation and so on [20, 21], binding all these claims to the whole genome, not to a single chromosome. Contrastively to the whole genome assumptions, in the report [22] the chromosome-centric transcriptome to proteome correlations were analyzed. The mRNAs levels were determined independently by quantitative PCR (qPCR) of Chr18 genes, and then supported by the next-generation sequencing on Illumina and SOLiD platforms and further by the shotgun MS data. Actually, studies in the field of Chr18 transcriptome profiling and targeted proteome mapping in liver tissue and HepG2 cells [6] revealed a poor correlation between transcriptome and proteome data. Radko et al. [8] investigated to which extent the targeted PCR-based transcriptome mining could contribute to the problem of the missing proteins, encoded by human Chr18 genes. A summary of these chromosome-centric efforts revealed the unexpectedly low quantitative correlation, with no satisfactory explanation [5]. To create at least some ground for the analysis of missing and uPE1 species, we have reanalyzed the transcriptome of Chr18 to gain more accurate data and assess the level of errors in such data by comparing the results from different platforms used for transcriptome quantitation. We recruited the gold-standard method of quantitative PCR (RT-PCR and ddPCR) together with well established HiSeq/Illumina. In addition to these methods, the recently emerged sequencing method articulated itself as the Oxford Nanopore Technology (ONT) was recruited here for C-HPP by using an ONT MinION sequencer [23], the low-cost portable sequencing machine. The technology produces lengthy reads up to 104 nucleotides (nt) advantageously to the Illumina platform, which could obtain reads of 50- to 300-nt long. However, the disadvantage of ONT is that long reads contain errors at the rate of approximately 3-5 lost or misread sites per 100 sequenced nt. ONT sequencing was characterized in genomics by reading up to 70 thousand nt, at the transcript level the read length was naturally limited by the mRNA length and quality. For the first time, this technology was applied to the human transcriptome [23] to analyze seven human cell lines and a set of tissue samples, including that of the human liver. For the LC2/ad cell line, the ONT performance was compared to short-read RNA-seq data with a reasonably good correlation (rp=0.88) between the methods. Authors [23] have thoroughly compared the expression levels of selected genes and found a significant correlation (rp=0.82) between ONT and qPCR, suggesting the ONT MinION is suitable for the quantitative assessment of the human transcriptome. Herein, by analysis of 3 samples of healthy livers and hepatocyte-related HepG2 cells, we pursued a double task. We have compared the three methods of transcript identification and quantification to understand, taking the Chr18 transcriptome as an example, the extent to which the quantitative profiles are consistent within the same biological sample. This question must be answered before explaining the poor transcriptome-proteome correlation. MATERIALS AND METHODS Human liver samples and HepG2 cells Samples of human liver were collected at autopsy from 3 male donors (designated further as donors #1, #3, and #5) aged 65, 38, and 54 years. The donors were HIV and hepatitis free, and the sections had no histological signs of liver diseases. The postmortem resected samples were immediately placed into RNAlater RNA Stabilization Solution (“Thermo Fisher Scientific”, USA) and stored at -20°C until further use. HepG2 cells (ATCC HB-8065, “ATCC”, USA) were grown to approximately 80% confluence and harvested. The cells were washed 3 times with PBS, counted using an EVE automated cell counter (“NanoEntek”, South Korea), pelleted by centrifugation, and kept in liquid nitrogen until further use. Transcriptome profiling using reverse transcription qPCR Transcriptome profiling with qPCR, total RNA was performed using liver tissue samples and HepG2 cells using the RNeasy Mini Kit (“Qiagen”, Germany) according to the manufacturer’s protocol. The on-column DNase digestion step was performed using the RNAse-Free DNase Set (“Qiagen”). The isolated total RNA was quantified using a Qubit 4 fluorometer and the Qubit RNA HS Assay Kit (“Thermo Fisher Scientific”), and the RNA quality was assessed using a Bioanalyzer 2100 System (“Agilent Technologies”). The RIN numbers for all preparations of total RNA were 7.5 or higher. Synthesis of cDNA was carried out using the AffinityScript qPCR cDNA Synthesis Kit and random primers (“Agilent Technologies”) according to the manufacturer’s recommendations. The cDNA samples were stored at -20°C until further use. The amount of each transcript encoded on Chr18 was assessed by measuring the number of copies of pertinent cDNA in the cDNA preparation derived from total RNA. qPCR was conducted in two formats—droplet digital PCR (ddPCR, 49 transcripts) and PCR in real time (PCR-rt, 226 transcripts)—employing the earlier designed set of primers and probes [22, 24], with minor exceptions. While ddPCR was performed as described previously [22, 24], the transcriptome profiling by PCR-rt was carried out using the ΔCt method [25]. To calculate the copy number of a transcript per cell, the copy number per PCR probe was normalized by dividing it by the amount of total RNA in the PCR probe (200 ng). The number of transcripts per nanogram of total RNA was brought to the copy numbers per cell based on the amount of total RNA in hepatocytes and HepG2 cells, reported to equal 40 pg/cell [26]. Illumina HiSeq sequencing and bioinformatics analysis Total RNA was isolated using the Extract RNA kit (“Eurogen”, Russia). RNA quality was evaluated using the Bioanalyzer 2100 System (“Agilent Technologies”). The RIN numbers varied from 7.3 to 9.1. Clustering and sequencing were carried out using the Illumina HiSeq 2500 system (2 lanes per 8 samples) according to the manufacturer’s protocols (Denature and Dilute Libraries Guide, Sequencing in Rapid Run Mode). For each replicate, we derived from 32 to 59 million reads. The derived fastq files were analyzed by FastQC and then were processed by Trimmomatic. The read mapping and expression quantification were carried out employing STAR 2.7 (splice-aware mapping to genome), bowtie2 (mapping to transcripts), RSEM 1.3 (quantifications of the reads), and Salmon (quasi-mapping and quantification) software packages. The genome GRCh38.p12 assembly (Ensembl release 97) was used as a reference. Finally, we compared the results obtained with STAR-RSEM, bowtie2-RSEM and Salmon, calculated the Spearman/Pearson correlation coefficients and created clustering dendrograms. The distance between samples/pipelines (i.e., dissimilarity rate) was evaluated as 1–corr.coeff. To create dendrograms, we used the complete linkage hierarchical clustering method. The sequencing data obtained in this study is available at NCBI Sequence Read Archive (BioProject ID PRJNA635536). MinION sequencing of HepG2 cells and liver transcriptomes Total RNA was isolated and characterized as for qPCR analysis. The extraction of mRNA from the total RNA preparations was conducted using the Dynabeads™ mRNA Purification Kit (“Thermo Fisher Scientific”) following the manufacturer’s recommendations. The mRNA preparations were immediately frozen and stored at -80°C until nanopore sequencing. Nanopore sequencing was carried out using the MinION sequencer (“ONT”, UK) with FLO-MIN107 flow cells and R9.4 chemistry and the Direct RNA sequencing kit (SQK-RNA002, “ONT”). The sequencing libraries were prepared strictly following the manufacturer’s protocol with a single exception: 750 ng of mRNA (poly+ RNA) was used as the input in both samples from human liver and HepG2 cell instead of the recommended 500 ng. The SuperScript III Reverse Transcriptase (“Thermo Fisher Scientific”) was used for reverse transcription and NEBNext, Quick Ligation Module (“New England Laboratories”, UK) was used for end repair and ligation. The Agencourt RNAClean XP magnetic beads (“Beckman Coulter”, USA) were employed for nucleic acid purification. The mRNA from HepG2 was sequenced in a 72-h single run. The output was 0.75-Gb sequenced transcripts (0.766 million reads) with a median length of 1.56 kb. The mRNA from the tissue liver of donor #1 was sequenced for 26 h. The flow cell was regenerated using the Flow Cell Wash Kit (“ONT”), strictly following the manufacturer’s guidance. Next, the newly prepared sequencing library from the liver mRNA of donor #1 was loaded on the flow cell and a 48-h sequencing run was initiated. The overall output was 1.44 million reads with a median length of 1.37 kb. The fast5 files produced by MinION were uploaded onto the Amazon Web Services ElasticCloud2 and processed using the GPU-powered (Nvidia Tesla V100) virtual instance p3.2xlarge (8x2.7 GHz vCPUs, 1 GPU) by the ONT-provided basecalling software guppy_basecaller [27] with parameters “-flowcell FLO-MIN107 -kit SQK-RNA002”. Further pipelines included the quality control by the MinIONqc.R script, followed by mapping the reads onto the gencode.v32.transcriptome using minimap2 v. 2.17 [28]. The overall statistics of alignment mapping was produced using the “samtools stats” command, and the quantitative data were further collected by executing the program Salmon. 0.12/1.1.0 with the command line options “quant -p 8 –noErrorModel” [29]. RESULTS AND DISCUSSION Overview of Chr18-coded missing and uPE1 proteins To characterize transcription of genes encoding uPE1 and MP, we performed analysis using the Oxford Nanopore system. In total, 1.5 million reads were obtained for liver cells, and more than 80% of these reads were successfully mapped to the human transcriptome version v32. Data for the same samples were collected using the orthogonal platforms Illumina (hereafter also called HiSeq) and quantitative PCR. The transcripts of the uPE1 proteins were expected to be detected at more than the transcripts encoding the missing proteins. However, the experimental data indicated the opposite: the level of protein transcription in both groups was comparably low. For example, for the uPE1 proteins TMEM200C and KLHL14, 15 TPM and 7 TPM were observed, respectively. The average expression level (for the values: TPM>0, n=8) was 4.48+2.67 TPM and 4.69+1.17 TPM for transcripts encoding missing and uPE1 proteins, respectively. We compared the values of the expression level of the studied group of genes (MP+uPE1) with the data obtained using alternative methods (Supplementary material Table S1). We confirmed, using both Illumina HiSeq and quantitative PCR, that the transcripts are expressed at an extremely low level, close to the detection limit. Thus, regarding the transcriptome of the studied biomaterials—that is, the liver and HepG2 cells—the genes encoding missing and uPE1 proteins were similar in the expression level and could be analyzed together. The use of the EMBL-EBI’s gene ExpressionAtlas [31] database revealed that the genes encoding the missing proteins are not expressed at a significant level in any of the analyzed tissues. For example, the highest values for the ELO3B gene reached a negligible level of 2 TPM in the choroid plexus, and HMSD, the most expressed gene, reached 11 TPM in the spinal cord and 14 TPM in transformed lymphocytes. However, genes encoding uPE1 proteins in some tissues reached 3–5 times higher values than the maximum values for missing protein transcripts: ANKRD29 reached 71 TPM in the lymph nodes or up to 57 TPM for a gene in the thyroid gland [31]. Confirmation of the above observations was found in ProteinAtlas. In the liver tissue and HepG2 cells, the transcription level of the uPE1 coding genes and missing proteins was comparatively low; however, in at least 1–2 tissues, the uPE1 proteins were expressed pronouncedly at the level of several dozen TPMs. An interesting observation was the TMEM241 gene, which, according to the data of RNA-Seq from ProteinAtlas, demonstrated little expression in the HepG2 cell line at the level of 5 TPM, producing zero values in all the samples by both sequencing methods used herein but was detected as low as 2.5 copies of cDNA per cell using ddPCR. The pronounced differences between uPE1 and missing proteins were observed in the NextProt portal and the associated PeptideAtlas resource: the uPE1s were usually highly populated using unique natural peptides, with little or no missing proteins. Notably, one missing protein (CTAGE1) from the number of missing proteins does not have unique proteotypic peptides during tryptic hydrolysis. Two other proteins demonstrated one proteotypic peptide each: the ANKRD30B protein peptide was found in prostate cancer samples [33], and the proteotypic peptide for HSBP1L1 was found in HepG2 cell samples [30]. Comparison of the NextProt releases from January and July 2020 revealed the transfers of proteins encoded by human Chr18. The SMIM21 protein has moved from the missing protein category to the uPE1 category. SMIM21 is characterized as “expression level 3” according to ProteinAtlas data, at a high level of normalized expression of mRNA NX=5.0 in the brain cancer line. Another protein, encoded by the C18orf65 gene, changed its category from PE2 to PE5, leaving the ranks of the missing proteins encoded by chromosome 18 genes. For the HSBP1L1 protein (74 a.a.r.), PeptideAtlas suggests one proteotypic peptide 24 a.a.r. long. It was detected in HepG2 and LNCaT cell lines by Professor Mann’s group [30] using the deep proteome coverage (8–12 thousand protein groups in the identification list) with the original SPIDER technology of low-loss digest mixture separation. Information has been published about the involvement of this gene in the development head and neck cancer [34], pancreas adenocarcinomas [35]. HSBP1L1 is involved in chemical hepatocyte injury [36], prioritizing this target to investigate the genetic aspects of liver diseases. In the July 2020 version of NextProt, this protein was transferred from the PE2 (e.g. missing proteins) to PE1 category, with the functional annotation at the “silver” level. To our knowledge, this transfer has not yet been confirmed by mass spectrometry data in accordance with the criteria of the guidelines of version 3.0 [37], at the same time MS-based support was delivered by top-down proteomics [38] in HeLa cells. So, at the time of this writing, the updated version of NextProt included 9 missing genes and 11 genes characterized as uPE1 from Chr18. The KLHL14 (uPE1) gene, represents a special case. According to results obtained by different methods, its transcripts were not detected in all biosamples, except the HepG2 sample, where its expression level measured by quantitative PCR was reported as 116 copies per cell. The expression level of the housekeeping gene ATP5F1A was comparable: 324 copies of cDNA per one HepG2 cell on an average. To rely on transcriptome data for the analysis of MP and uPE1 proteins encoded by chromosome 18 genes, exhibiting low transcription levels, it is necessary to confirm the reliability of the basic data. In view of this assumption we considered the datasets in two ways: comparison of the list of highly expressed genes – “Stakhanovite genes” [39] and deciphering a degree of correlation between analytical methods. “Stakhanovite genes” are named after the Soviet coal miner Alexey Stakhanov renowned for his outstandingly hard everyday work. We present a parallel between the expression of genes which are everyday hard-workers, in contrast to the genes which are smart-workers. The smart-working genes are not as highly expressed but are regulating the whole process [32]. “Stakhanovite genes” of Chr18 MP and uPE1 proteins encoded by the human Chr18 are characterized by low expression of corresponding genes in the liver and HepG2 samples. To estimate the contribution of error in the sample preparation and measuring methods, we started not from the low expressed transcripts, but, oppositely, from the extremely high abundant ones produced by “Stakhanovite genes” (Fig. 1).
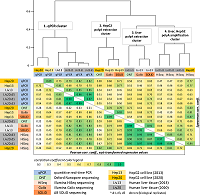
Supporting Information Table S2 shows five of the leading “Stakhanovite genes” for each sample studied, exhibiting the highest levels of expression as revealed by ONT MinION, Illumina HiSeq, and qPCR analysis. These 5 topmost genes are responsible for a substantial part of the total mRNA abundance. For example, in the case of ONT MinION sequencing, more than 95% of the total mRNA abundance was attributed to the corresponding “Stakhanovite genes” in both HepG2 cell and liver samples. In this case, the RPL17 gene encoding 60S ribosomal protein L17 — a component of the ribosomal complex—leads the list of “Stakhanovite genes” for HepG2 cells. The gene encoding transthyretin, TTR, has demonstrated the highest expression in the liver, that secretes blood plasma components. In addition to RPL17, other housekeeping genes were revealed by ONT sequencing: MYL12A and MYL12B encoding chains of the motor protein myosin, ATP5F1A encoding the ATP-synthase subunit alpha responsible for the energy generation in mitochondria, and CYB5A encoding cytochrome b5, the membrane-bound electron carrier. Among these genes, 4 top genes were common for HepG2 cells and liver tissue, showing a considerable level of qualitative concordance between the biological samples of different origin. Illumina HiSeq sequencing also revealed some level of qualitative concordance among the “Stakhanovite genes” for HepG2 cells and liver tissue samples: TTR and RPL17 were expressed in all liver samples and HepG2 cells, NDUFV2 as well as MYL12A were present in HepG2 and at least in two of three liver samples (Fig. 1 and Supplementary material Table S2). The similar level of qualitative concordance among “Stakhanovite genes” was found between the liver samples studied. For qPCR analysis, a relatively high level of matching was observed for the subsets of “Stakhanovite genes” among liver tissue samples: a coincidence of 4 of 5 or even 5 of 5 among the lists of highly expressed genes. Surprisingly, the level of concordance between the subsets of “Stakhanovites” revealed by two sequencing platforms, ONT MinION and Illumina HiSeq, was rather moderate: only 4 items were shared between HepG2 cells and the liver sample, TTR, RPL17, MYL12A and CYB5A were among them. A similar situation was observed for the liver sample when the ONT MinION or Illumina HiSeq data were compared with the qPCR data: only 3 of 5 top genes coincided. When the qPCR data were compared with the HiSeq dataset for the liver tissue samples of donors #3 and #5, only 2 matching hits were identified (out of 5 selected “Stakhanovite genes”). Moreover, for HepG2 cells, no concordance was found between the subset of “Stakhanovite genes” revealed by qPCR and those revealed by either the ONT MinION or Illumina HiSeq sequencing (Supplementary material Table S2). The leaves of the dendrograms in Fig. 1 correspond to the highly expressed genes of Chr18 (topmost 13 expressed genes, appeared in at least one sample in the Supporting Information Table S2, were taken for this analysis). Clustering was performed based on the distance metrics, which corresponded to the difference in the values of gene expression, therefore, the closer were leaves at the tree, the more similar were the estimations of expression (either FPKM, copies of cDNA per cell or TPM). Fig. 1A represents the results of the analysis using two different methods for the same liver sample. The leaves were severely mixed between clusters, which were visually observed as crosses between edges connecting two dendrograms. Among the 10 probed genes, only two pairs preserved their closeness in both dendrograms: MAPRE2 neighboring AFG3L2 and subcluster MYL12 subunits A and B. No such neighboring was observed when different samples were compared by a single method, the ONT (Fig. 1B). The assessment of entanglement as a measure of concordance between dendrograms produced similarly low values of 0.31 and 0.28 for Fig. 1A and 1B, respectively. Thus, working within a single chromosome of 265 protein-coding genes, even for the case of highly expressed genes, the relationship between the quantitative estimations of the expression level was highly discordant. Although this finding may be expected for the samples of normal liver and HepG2 cells derived from hepatoblastoma, it was rather surprising to find such disparity in the results acquired from the same sample analyzed using different methods. Correlations of chromosome-centric transcriptome datasets Different methods of transcriptome analysis may give different results [7, 17, 41]. At the genome scale, the frequency of RNA-Seq transcripts provides clues for MS identification of the corresponding protein [42]. However, the feature of chromosome-centric quantitative transcriptomics (presumably of quantitative proteomics as well) is that when the number of genes is reduced compared with that in the genome, the admissible correlations can be severely affected. This can be especially true for Chr18 with a rather small number of genes. Regarding qPCR, 235 of 275 transcripts encoded on Chr18 were identified in both HepG2 cells and the liver samples of each of three donors, while 16 transcripts were detected neither in HepG2 cells nor in the liver samples of any of the donors (Supplementary material Table S1 and Fig. S1). Furthermore, 14 transcripts were not found in HepG2 cells but were observed in a liver sample of at least one donor, and 10 transcripts were present in HepG2 cells but not in a liver sample of at least one donor (Supplementary material Table S1). For common transcripts of HepG2 cells and the liver samples, a good correlation was observed between the levels of the Chr18 log-transformed gene expression values (Supplementary material Fig. S2.1, panels A to C). The values of the Pearson correlation coefficient, rp, are within the narrow interval of 0.76–0.79, agreeing well with the previously obtained rp value of 0.78 for the ‘HepG2 cells vs. pooled liver sample’ correlation [22]. At the same time, the correlations between the transcript abundances in the liver tissue between donors were found to be strikingly high: rp = 0.963–0.966 (Supplementary material Fig. S2.1, panels D to F). Similar to qPCR data, a higher correlation was observed between gene expression profiles derived with Illumina HiSeq (log-transformed FPKM values) in liver tissue samples – rp = 0.827-0.925 (Supplementary material Fig. S2.2). Liver gene expression, quantified by the Illumina HiSeq, was also well correlated with that in HepG2 cells: rp values were within the interval of 0.691–0.812 and agreed with those obtained by qPCR profiling (Supplementary material, Fig. S2.2 vs. Fig. S2.1). Compared with the short-read sequencing such as Illumina, the long-read ONT sequencing is a relatively new technology. It should be considered as orthogonal to HiSeq, and different bioinformatics analyses are eventually required to treat the raw data. Although the LAST and BWA algorithms (originally developed for the mapping of short reads [42, 43]) were also employed for ONT data processing [23], the minimap2 tool [44] is nowadays widely used for long noisy read mapping. Thus, we prepared three datasets from the orthogonal methods and performed correlation analysis supplied with a cluster dendrogram (Fig. 2, Supplementary material Table S3). The upper triangle of the matrix in Fig. 2 contains the Spearman correlation coefficient between the gene expression values determined by qPCR (number of cDNA copies per cell), Illumina HiSeq, and ONT. Additionally, we calculated Pearson correlation coefficients (lower triangle of the matrix, Fig. 2, Supplementary material Table S2) for the expression values, which were square root transformed to reduce the dominant effect of highly expressed genes. The dendrogram was created based on the Spearman rank correlation coefficients (hierarchical clustering using Ward’s D2 method).
In this study, we also included our previous results [24], which were obtained using Illumina GaIIx and Applied Biosystems SOLiD platforms for the HepG2 cell line (denoted as Hep13 in Fig. 2, originating from a different source than the HepG2 cells used in the current study) and from the pooled sample of three human livers (denoted as Liv13). As can be seen from the dendrogram (Fig. 2), the gene expression profiles are clustered into four groups. The division occurs at the level of the methodology: the first cluster was attributed to quantitative PCR method, while other three clusters accommodate the results of next-generation sequencing. Furthermore, to a lesser extent, in the case of qPCR, a separation occurred according to the type of biological material. In the case of sequencing, a separation occurred according to both the biomaterial type and cDNA/mRNA library preparation method. These findings are presented more clearly in the Supplementary material Table S3, which includes data on technical replicates and various RNA-Seq data processing pipelines. At the same time, clusters 2 and 3 combined the data from various platforms—Illumina GaIIx, AB SOLiD, and ONT MinION. These libraries were prepared by polyA mRNA isolation using magnetic microbeads. Finally, cluster 4 included data on HepG2 and liver samples prepared using polyA amplification. One possible reason for this discrepancy between library prep techniques may be a difference in RNA integrity. Low initial RNA integrity as well as an improper sample preparation procedure induces a shift in the density read coverage towards the 3′-tail of transcripts when using polyA isolation/amplification methods. Thus, we evaluated the differences in the distribution of 5′-to-3′ read coverage density and fortunately found no significant differences between cluster 4 and clusters 2/3 (i.e., between polyA mRNA isolation using the microbead technique and polyA amplification using MINT reverse transcriptase). The data in Supplementary material Table S3 provides information on how fragile are dependencies between samples, sample preparation methods, bioanalytical platforms and bioinformatics pipeline of transcriptome data processing. Such dependencies are usually ignored at the whole-genome level. The chromosome-centric current phase of discovery of the missing and uPE1 proteins appeals to re-think the paradigm at the transcriptome level. With several exceptions, the Spearman (rank) and Pearson correlation coefficients were concordant. The highest Spearman’s rank correlation (r = 0.70–0.97) was observed for the qPCR methods (cluster 1). Within this cluster, there were two biomaterials—specific subclusters. Within the clusters in greeny we observed the data formed into the groups according to the year of analysis. In general, the observed correlation pattern indicated that qPCR works much better with low-expression genes than with RNA-Seq mainly because of the stochastic noise and discrete nature of gene expression values derived with RNA-Seq (i.e., read counts). Notably, different clustering methods produced different results: preferred grouping was observed either by biological material or method. However, the close relationship between the technical replicates and bioinformatics pipelines remained invariant in the dendrograms. Nonetheless, we did not observe a perfect match between the results obtained using various genome annotations (RefSeq/Ensembl/Gencode) and data processing protocols (STAR+RSEM, bowtie2+RSEM, Salmon), as well as between technical replications: the Spearman correlation coefficient between various data processing pipelines or technical replicates ranging from 60% to 97%. ONT-oriented selection of missing and uPE1 proteins We observed a large variability among gene expression values derived by RT–qPCR, Illumina and ONT sequencing from the same biological sample. However, the present work was not intended to clarify the underlying reasons for this variability, but we aimed to highlight that a relatively high correlation between various datasets derived by whole-transcriptome analysis came primarily from the large dynamic range of transcript abundances. Despite the sampling was confined by a particular chromosome (Chr18, 265 protein-coding genes), the dynamic range of transcript abundances was still fairly large. Nonetheless, the general correlations may decline (compare the values of correlation coefficients in Fig. 4 with those of 0.92 or 0.9, reported for 18000+ genes by Tyakht et al. [17] or van Deft et al. [45], respectively). For a more limited set of genes—even if these genes are highly expressed such as in the case of “Stakhanovite genes”—obvious disagreement occurred in the levels of their expression measured by the orthogonal methods (tanglegram in Fig. 1A, see also Supplementary material Table S2). The dendrogram topologies (the branching pattern relationship among individual genes) were quite different for the RT–qPCR and Illumina methods (Fig. 1B). For a set of low-abundance transcripts, one should expect a more profound “noise effect”—the apparent well-known fact from whole-transcriptome analysis. Additionally, the number of low-abundance transcripts is heavily affected by TPM and FPKM threshold values set for ONT and Illumina methods, respectively. For example, taking the TPM/FPKM threshold values as ≥ 0.1 resulted in ~60% of Chr18 transcripts detected by all three methods (Supplementary material Fig. S1), while setting the Illumina’s FPKM threshold as > 0.1 would result in less than 50% of such transcripts.Because we learned from the Expression Atlas (EMBL-EBI) generally and from our own data particularly, that the target missing and uPE1 proteins were present in low copies, we focused on the presence of a corresponding gene product in all samples, detected by all the methods employed. The lower is the level of expression, the more nonrandom would be such an observation. Therefore, in the low-copy range, correlation analysis should be replaced by the unraveling of rarely observed events. This enabled us to perform a simple selection of priorities for the MP/uPE1 array as follows. From the compendium of the ONT-detectable genes, we selected those that exhibited nonzero values of TPM in both types of biomaterials—i.e., the liver and HepG2. Two missing proteins and four proteins with the uPE1 status were obtained (Table 1). The following information was taken from the neXtProt in Table 1: the a.a.r. number of the proteoform designated as Iso1 (a canonical sequence, often the longest one), number of variant records reported for a given protein as single-amino acid polymorphisms, and the number of isoforms (assuming that these could be splice forms or processed forms). Table 1 was completed by indicating for the selected set of genes the FPKM values (Illumina HiSeq), number of cDNA copies (qPCR), and TPM values (ONT MiniION).Table 1 enabled us to consider interesting cases of the HSBP1L1 missing protein and C18orf21, the uPE1 protein. Compared with other proteins, these two proteins were covered by ONT reads at modest but detectable levels. By contrast, for example, the serpin-like protein HMSD was poorly represented by the ONT-derived transcripts and undetected by the HiSeq NGS platform. Because of negligible detection, the uPE1 proteins KLHL14 and TMEM200C were discarded. Notably, KLHL14 showed an unexpected finding: the qPCR estimation was 116 copies per cell, including it in a list of “Stakhanovite genes” (Fig. 1).
As of January 2020, the heat shock factor-binding protein (HSBP1L1) was still missing, probably because of its tiny size of only 75 a.a.r. Additionally, HSBP1L1 was constitutively expressed in the liver and HepG2 cells at the level of approximately 6–7 transcripts per million (roughly corresponding to 1 cDNA copy per cell). The values of FPKM were at the level of 3.5 for liv.d1, and, remarkably, this protein was also detectable in other samples, viz. liv.d3 and liv.d5. Another interesting case is was UPF10711 protein, encoded by C18orf21 gene. According to the neXtProt record Q32NC0, this protein was characterized by two isoforms, Iso1 (220 a.a.r.) and Iso2 (first 88 a.a.r. of Iso1 were missing from Iso2), or three computationally mapped potential isoforms. The ONT approach enabled detection in the liver at the levels of transcription of 0.67 and 4.85 TPM units for the isoforms with accession numbers NX_Q32NC0-1 and NX_Q32NC0-2, respectively. Illustratively, regarding C18orf21, the Sashimi plot was produced to depict the splicing junctions observed by ONT MiniION and Illumina HiSeq technologies (see Supplementary material Fig. S3). Four exons were observed, connected by three solid splice junctions with certain alterations of splice junctions between the first and second exons. The sequence of the proteotypic peptide was observed at the third exon, being safe from the splicing perturbations. We used the standard file of the transcriptome data, which indeed could not resolve the unexpected splicing events. The deficiency of splicing information should be seriously considered at the current and forthcoming phase of C-HPP. CONCLUSIONS The expression of approximately 50%–60% genes (depending on the biospecimen type) was detected simultaneously by qPCR, Illumina and Oxford Nanopore Technology (ONT)-based transcriptome sequencing (Supplementary material Fig. S1). The most sensitive method of qPCR delivered the expression of 64% of the Chr18 genes in the liver tissue, and much more (77%) in HepG2. In total, 92% of the Chr18 coverage was achieved at the transcriptome level by compiling the data from different methods and only two types of biospecimens. In the present work, we appended the ONT as the independent “third vote” to the previous pair of well-established methods such as qPCR and Illumina sequencing for transcriptomic research. We examined this problem in detail a sign an example of the HSBP1L1 gene as a promising target for investigation. Our choice was further confirmed, because in the July 2020 version of NeXtProt HSBP1L1 left the pool of missing proteins and gained the respectful PE1 status. By analyzing jointly the missing and uPE1 proteins, we distinguished C18orf21 to study its function in the HepG2 cell line in the frame of CP50 challenge. The level of transcription of the gene is elevated up to 10 times in HepG2 cells compared with that in the liver (see Table 1). Another uPE1 protein – KLHL14 – demonstrated outstanding mRNA expression, comprising 168 mRNA copies in a single HepG2 cell determined by RT–PCR. The high expression of KLHL14 as a “Stakhanovite gene” of HepG2 was observed in contrast to the absence of its expression in the individual liver tissues. We showed significant differences in the transcriptomic results obtained using different experimental methods: for many genes, they reached one order of magnitude. If we consider qPCR as the gold standard, RNA-Seq-based approaches may represent a reliable method only for qualitative evaluation of gene expression, whereas quantitative assessment may be significantly biased because of differences in sample preparation protocols and data processing pipelines. It was illustrated that, in connection with the problem of the detection of low-abundant transcripts, there was also the problem of approaching an actual picture of gene expression at the transcriptome level, unbiased by the sample preparation and data treatment procedures. In this study, we showed the limitations of the correlation analysis of the quantitative omics data, particularly, its strong dependency on the choice of the correlation/clustering method. Spearman’s rank correlation analysis results are more susceptible to inaccuracies in the RNA-seq analysis of lowly expressed genes, but Pearson’s correlations are very prone to outliers for highly expressed genes. In any case, a great random component contributes to the results. FUNDING The bioinformatics work was supported by the Russian Science Foundation grant #20-14-00328, using the equipment of the EIMB RAS “Genome” center (http://www.eimb.ru/rus/ckp/ccu_genome_c.php). The authors are grateful to the “Human Proteome” Core Facility, Institute of Biomedical Chemistry (IBMC) for performing PCR and RNA-Seq (ONT) and to Genotek Ltd. (Moscow, Russia) for performing RNA-Seq (Illumina). COMPLIANCE WITH ETHICAL STANDARDS The study was conducted with the approval of the Ethics Committee of the Pirogov Russian State Medical University (Protocol no. 3 of March 15, 2018) with the informed consent of the donor’s representatives. CONFLICT OF INTERESTS The authors declare that they have no conflict of interest. SUPPLEMENTARY Supplementary materials are available at http://dx.doi.org/10.18097/BMCRM00144 REFERENCES
|