|
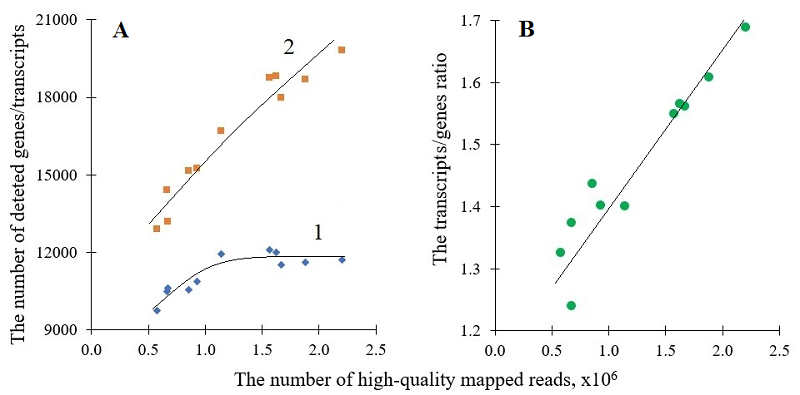
THE IMPACT OF SEQUENCING DEPTH ON THE NUMBER OF TRANSCRIPT SPLICE VARIANTS REVEALED BY MinION NANOPORE SEQUENCING Institute of Biomedical Chemistry, 10 Pogodinskaya str., Moscow, 119121 Russia; e-mail: radkos@yandex.ru Key words: nanopore sequencing; transcribed genes; transcript splice variants; sequencing depth DOI: 10.18097/BMCRM00300 INTRODUCTION The processing of a precursor messenger RNA (pre-mRNA) molecule into several mRNA transcripts (transcript’s isoforms or splice variants), known as “alternative splicing” (AS) [1], significantly enhances the diversities of transcriptome and proteome [2, 3]. In pre-mRNAs of higher eukaryotes, the splice sites can be differentially selected. This results in a number of single gene transcripts, varying in an exon composition and/or by the presence of intron sequences fully or partially retained [3, 4]. AS is a highly regulated process [5, 6]. The aberrations in AS have been associated with some pathological states which include hereditary diseases and cancer [5, 6]. The emergence and wide spread of next generation sequencing have brought the analysis of AS to a whole-transcriptome level [2, 7]. RNA sequencing employing both the short-read and long-read technologies was used to study AS. In the latter case, the nanopore-based sequencing developed by Oxford Nanopore Technologies (ONT) has become most common, especially with the use of MinION, a portable ONT sequencer (e.g., [8-12]). The short-read RNA sequencing (RNA-seq) is known to face difficulties when determining the exon connectivity. This makes this type of sequencing prone to errors when short reads are to be assembled into splice variants of a given transcript [2, 13, 14]. In contrast, the ONT-based sequencing is free from the problems associated with the reads assembling and allows for direct splice variant profiling [15]. Transcriptome-wide AS profiles can be described either as an assembly of all detected splice variants characterized by their abundances [16-18] or as an assembly of genes characterized by the number of splice variants which were detected for each gene [19, 20]. Clearly, both the number of transcribed genes and the overall number of identified splice variants, revealed by RNA-seq, depend on the depth of sequencing [21]. In RNA-seq, the total amount of sequenced nucleotides (or the total amount of reads) can be preset that eventually determines the sequencing depth. Yet, for ONT nanopore sequencing, the reads output may substantially vary in different sequencing runs. The number of reads produced from a MinION run heavily depends on an actual quality of a sequencer’s flow cell. This quality is determined by a number of factors, including the initial quality of a flow cell, as well as duration and conditions of shipment and storage. In many instances, these factors cannot be completely controlled. The aim of the study was to evaluate to which extent the variations in reads output influenced the number of splice variants revealed in MinION-based sequencing. The answer to this question is important for comparability of biospecimens analyzed in different MinION runs when performing AS profiling. The splice variants with modest and low abundances are thought to be mostly affected by variations in the sequencing depth from run to run [22]. It can make the revealed differences in AS profiles a technical artefact rather than the true differences between biospecimens. To evaluate the influence, the number of transcribed genes and identified splice variants was analyzed as a function of the number of high-quality mapped reads produced by MinION sequencing of mRNA extracted from human liver specimens and hepatocyte-derived cell lines HepG2 and Huh7. METHODS The human liver tissue samples (n = 3) were collected post-mortem. The collection was approved by the Ethical Committee of the N.I. Pirogov Russian State Medical University. The cell lines HepG2 and Huh-7 were received from Merck (Germany) and Thermo Fisher Scientific (USA), respectively. All details on the tissue sample collection and the culturing of HepG2 and Huh-7 cells can be found elsewhere [19, 20]. Total RNA was isolated with a RNeasy Mini Kit (Qiagen, Germany) and its quality was evaluated with a Bioanalyzer 2100 System (Agilent Technologies, USA). The values of 7.8 or higher were obtained for RNA integrity numbers (RINs) in all cases. The isolation of mRNA was done using a Dynabead mRNA Purification Kit (Thermo Fisher Scientific). The mRNA concentration was measured on a Qubit 4 fluorometer, using a Qubit RNA HS Assay Kit (Thermo Fisher Scientific). A kit for direct RNA sequencing (SQK-RNA002) from ONT (UK) was used to prepare sequencing libraries, in a strict accordance with the protocol of the manufacturer. Each sequencing was performed in a single run for 48 h with a flow cell FLO-MIN106 (ONT) on a nanopore sequencer MinION (ONT). The raw sequencing data obtained were processed post-run with the software “guppy_basecaller” (v. 3.1.5, ONT) as described earlier [23]. The quality score parameter for data filtering was set as >7.0 (the default value recommended by the software manufacturer). The additional control of reads quality was carried out by using the MinIONqc.R script [24]. The long-read aligner “minimap2” (v. 2.17) [25] and the release GRCh38 of the genome assembly Gencode38 (https://www.gencodegenes.org/human/release_38.html, last accessed on August 5, 2025) were employed to map the reads. The mapping was performed in the mode “-ax splice junc-bed”. The files with sequencing data are deposited to the NCBI Sequence Read Archive (PRJNA765908, PRJNA893571, PRJNA635536). RESULTS AND DISCUSSION Figure 1A shows dependencies for the number of identified transcribed genes and the overall number of identified transcripts (splice variants) on the amount of high-quality mapped reads. Here transcribed genes are the genes for which at least one splice variant has been identified based on the MinION sequencing data produced in a given run. The data were plotted regardless of their origin (wherever they come from human liver tissue, HepG2 or Huh7 cells). As seen, all points fall into two master curves in the studied range of mapped reads (from about 0.58 to about 2.3 million reads): one master curve for the number of genes and another one – for the number of transcripts (Figure 1A). The increase in the number of genes appears to level off when the number of mapped read slightly exceeds a million. Apparently, about 12 thousand genes are actively transcribed in human normal liver tissue and malignantly transformed hepatocytes and about 1.2 million reads allow for detecting practically all of them in the MinION sequencing run with the yield of about 1.2 million or more high-quality mapped reads (Figure 1A). In contrast to the genes, the number of detected transcripts keeps growing with the number of mapped reads in almost a linear fashion over the entire range studied (Figure 1A). When the average numbers of transcripts per gene were calculated (by dividing the overall number of transcripts revealed in a given MinION sequencing run by the corresponding number of genes), they demonstrated a steady growth over the range of mapped reads: the average number of transcripts per gene has risen from about 1.3 to about 1.7 (Figure 1B). Clearly, with the increase in sequencing depth, the low expressed splice variants for transcripts of already identified genes become detected. Since the average number of transcripts per gene is obviously a function of sequencing depth (Figure 1B), the present data did not allow us to estimate the actual average number of splice variants for a transcript in human liver tissue and hepatocyte-derived cells However, for example, one of the Ensemble annotations reported 21,694 protein-coding genes and 39,106 corresponding transcripts (https://www.ensembl.org/info/genome/genebuild/2014_07_human_genebuild.pdf, last accessed on September 2, 2025). These numbers give about 1.8 transcript per gene. The ratio is quite close to 1.7, achieved in our study with the output of 2.3 million mapped reads. One may suggest that practically all transcript splice variants can be detected for transcribed genes in human liver tissue and hepatocyte-derived cells in a single MinION run with the output of 2.3 million or more mappable reads. The results obtained evidently demonstrate that sequencing depth has to be matched in the MinION-based nanopore sequencing to correctly compare AS profiles between various tissues and cells or their states for finding biologically related differences. Since the sequencing output can vary manyfold between MinION runs, the simplest way to match the sequencing depth may be to equal the number of mapped reads taken into bioinformatic analysis. It can easily be done with the Picard DownsampleSam tool (https://broadinstitute.github.io/picard/, accessed on September 7, 2025) which allows for randomly selecting the desired number of reads for further analysis. The disadvantage of such approach is that all sequencing outputs have to be adjusted to the output with the minimal number of high-quality mapped reads. It should be noted that in the present study all identified transcripts were taken into consideration, regardless of their abundance. The transcript abundance can be taken into account by setting a threshold for transcript abundance, below which the detection of transcripts is considered as statistically insignificant. It is commonly to use the value of 0.1 as a threshold for transcript abundance expressed in TPM (transcripts per million) [26]. When transcripts with abundances below the threshold of 0.1 were removed from consideration, the number of identified genes practically did not change. At the same time, the number of identified transcripts and, consequently, the average number of transcripts per gene slightly decreased. Nonetheless, the shapes of curves describing the relationships between the numbers of genes, transcripts, and the mapped reads (data not shown) were similar to those of curves 1 and 2 in Figure 1A.
CONCLUSIONS In MinION-based nanopore sequencing, the yield of detected genes and transcripts substantially depends on the sequencing depth presented as the sequencing output in high-quality mapped reads. While practically all of actively transcribed genes appear to be detected when the reads output exceeds 1.2 million, the number of revealed transcripts steadily increased over the studied range of reads output. The yield of more than 2.3 million high-quality mapped reads would be required in the MinION-based nanopore sequencing in order to approach the level of 1.8 transcripts (splice variants) per gene, expected from the known numbers of annotated genes and transcripts for human genome. The sequencing data used have been produced for human liver tissue and hepatocyte-derived cells and it is still to be seen whether the made conclusions can be generalized to other types of cells and tissues. COMPLIANCE WITH ETHICAL STANDARDS The collection of human liver tissue samples was approved by the Ethical Committee of the N.I. Pirogov Russian State Medical University (Protocol #3; March 15, 2018). FUNDING This work was financed by the Ministry of Science and Higher Education of the Russian Federation within the framework of Agreement No. 075-15-2024-643. CONFLICT OF INTEREST The authors declare no conflict of interest. REFERENCES
|