The Filtration of 2D Electrophoresis Data during Creation of a Learning Set for Prediction of the Value of the Isoelectric Point of Proteins
Institute of Biomedical Chemistry, 10 Pogodinskaya str., Moscow, 119121 Russia; *e-mail: vladlen@ibmh.msk.su
Keywords: isoelectric point; 2D electrophoresis; data collection
DOI: 10.18097/BMCRM00162
A number of simple filters formulated from general considerations that take into account the peculiarities of the experiments as well as results obtained in 2D electrophoresis experiments are considered. These filters can be used for automated dataset formation and verification of learning of system for predicting protein isoelectric point values. These include: (i) filtering obvious errors introduced during initial database formation; (ii) selection of a known plausible range of values; (iii) selection of a single variant among various proteoforms; (iv) selection within a preset value of electrophoretic shift deviation, etc. Using a dataset combining data from 8 maps of Homo sapiens, Mus musculus, and Rattus norvegicus, the application of this set of filters improved the R2 value of predictions from 0.44 to 0.67.
|
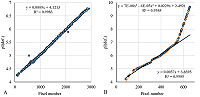
Figure 1.
The comparison of assigned pI values and coordinates along the abscissa axis on the 2D electrophoretic map. A. Data from RAT_INS1E_4-7 - there are 2 points with errors. B. Data from RBC_HUMAN - a cubic spline equation describing the entire data set and an equation describing a linear section are shown. If the data are obtained in a single experiment and without failures, there should be no "step" near 310 pixel.
|
|
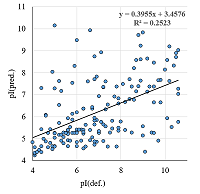
Figure 2.
The comparison of the assigned pI values and the values predicted by the method of Bjellqvist et al. for the data set from the 2D electrophoretic RADIAL_NERVE_CORD_3-11 map. All identified proteins are homologues of Marthasterias glacialis proteins from other organisms.
|
|
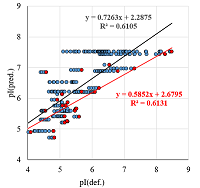
Figure 3.
The comparison of the assigned pI values and the values predicted by the method of Bjellqvist et al. for the data set from the 2D electrophoretic CSF_HUMAN map (one point without modifications with delta pI >3 was discarded). Blue is all variants, red is only one most basic variant for each of the proteins.
|
|
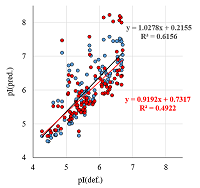
Figure 4.
The comparison of the assigned pI values and the values predicted by the methods of Bjellqvist et al. (red) and pIPredict 3 (blue) for the data set from the 2D electrophoretic map RAT_INS1E_4-7.
|
|
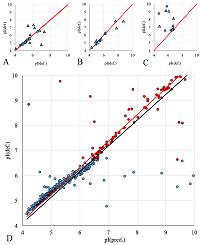
Figure 5.
A, B, C - The pairwise comparison of the assigned pI values from different experiments (Homo sapiens, Mus musculus and Staphylococcus aureus). D - Comparison of assigned and predicted pI values for Staphylococcus aureus proteins obtained from different 2D maps (blue - STAPHY4-7, red - STAPHY6-11). |
|
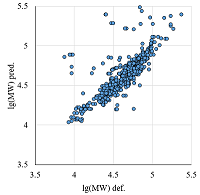
Figure 6.
The comparison of calculated and observed lg(MW) values for the set combining data from Homo sapiens, Mus musculus, and Rattus norvegicus maps. |
|
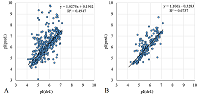
Figure 7.
The comparison of assigned and predicted pI values for a set of proteins combining data from Homo sapiens, Mus musculus, and Rattus norvegicus maps. A. The filtering for explicit errors only, selection of linear part depending on pixel coordinates, selection of most basic value in the presence of variants. B. The filtrion by lg(MW) value <= 0.05 is added. |
|
CLOSE
|
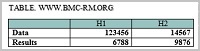
Table 1.
2D electrophoresis maps that were used in this work.
|
FUNDING
The work was performed within the framework of the Program for Basic Research in the Russian Federation for a long-term period (2021-2030) (№122030100170-5).
Supplementary materials are available at http://dx.doi.org/10.18097/BMCRM00162
REFERENCES
- Skvortsov, V.S, Voronina, A.I., Ivanova, Y.O., Rybina, A.V. (2021) The Prediction of the Isoelectric Point Value of Peptides and Proteins with a Wide Range of Chemical Modifications. Biomedical Chemistry: Research and Methods, 4(4), e00161. DOI
- Po, H.N., Senozan, N.M. (2001) The Henderson-Hasselbalch Equation: Its History and Limitations. Journal of Chemical Education, 78, 1499-1503. DOI
- Kozlowski, L.P. (2021) IPC 2.0: prediction of isoelectric point and pKa dissociation constants. Nucleic Acids Research, 49(W1, 2), W285–W292. DOI
- Naryzhny, S.N., Legina, O.K. (2019) Structural-functional diversity of p53 proteoforms. Biomeditsinskaya khimiya, 65(4), 263-276. DOI
- Bjellqvist, B., Hughes, G.J., Pasquali, C., Paquet, N., Ravier, F., Sanchez, J. C., Frutiger, S., Hochstrasser, D. (1993) The focusing positions of polypeptides in immobilized pH gradients can be predicted from their amino acid sequences. Electrophoresis, 14(10), 1023–1031. DOI
- Kozlowski, L. P. (2022) Proteome-pI 2.0: proteome isoelectric point database update. Nucleic acids research, 50(D1), D1535-D1540. DOI
- Kitchin, R. (2014) Big Data, new epistemologies and paradigm shifts. Big data & society, 1(1), 2053951714528481. DOI
- Hoogland, C., Mostaguir, K., Appel, R.D., Lisacek, F. (2008) The World-2DPAGE Constellation to promote and publish gel-base d proteomics data through the ExPASy server. Journal of proteomics, 71(2), 245–248. DOI
- The UniProt Consortium (2021) UniProt: the universal protein knowledgebase in 2021, Nucleic Acids Research, 49(D1), D480–D489. DOI
- Sanchez, J. C., Chiappe, D., Converset, V., Hoogland, C., Binz, P.A., Paesano, S., Appel, R.D., Wang, S., Sennitt, M., Nolan, A., Cawthorne, M.A., Hochstrasser, D.F. (2001) The mouse SWISS-2D PAGE database: a tool for proteomics study of diabetes and obesity. Proteomics, 1(1), 136–163. DOI
- Sanchez, J.C., Appel, R.D., Golaz, O., Pasquali, C., Ravier, F., Bairoch, A., Hochstrasser, D.F. (1995) Inside SWISS-2DPAGE database. Electrophoresis, 16(7), 1131–1151. DOI
- Demalte-Annessi, I., Sanchez, J.-C., Hoogland, C., Rouge, V., Binz, P.-A., Appel, R.D., Hochstrasser D.F. (1999) Submitted JAN-1999 to SWISS-2DPAGE. Retrieved from: https://world-2dpage.expasy.org/swiss-2dpage/map=dld1_human
- Golaz, O., Hughes, G.J., Frutiger, S., Paquet, N., Bairoch, A., Pasquali, C., Sanchez, J. C., Tissot, J. D., Appel, R.D., Walzer, C. (1993) Plasma and red blood cell protein maps: update 1993. Electrophoresis, 14(11), 1223–1231. DOI
- D'Hertog, W., Maris, M., Thorrez, L., Waelkens, E., Overbergh, L., Mathieu, C. (2011) Two-dimensional gel proteome reference map of INS-1E cells. Proteomics, 11(7), 1365–1369. DOI
- Plikat, U., Voshol, H., Dangendorf, Y., Wiedmann, B., Devay, P., Müller, D., Wirth, U., Szustakowski, J., Chirn, G.W., Inverardi, B., Puyang, X., Brown, K., Kamp, H., Hoving, S., Ruchti, A., Brendlen, N., Peterson, R., Buco, J., Oostrum, J. v., Peitsch, M.C. (2007) From proteomics to systems biology of bacterial pathogens: approaches, tools, and applications. Proteomics, 7(6), 992–1003. DOI
- Franco, C.F., Santos, R., Coelho, A.V. (2011) Exploring the proteome of an echinoderm nervous system: 2-DE of the sea star radial nerve cord and the synaptosomal membranes subproteome. Proteomics, 11(7), 1359–1364. DOI
- Rath, A., Glibowicka, M., Nadeau, V. G., Chen, G., Deber, C. M. (2009) Detergent binding explains anomalous SDS-PAGE migration of membrane proteins. Proceedings of the National Academy of Sciences, 106(6), 1760-1765. DOI