pIPredict Version 2: New Features and PTM Analysis
Institute of Biomedical Chemistry, 8119121 Pogodinskaya Str., 10 bldg. 8, Moscow, Russia,*e-mail: vladlen@ibmh.msk.su
Key words: protein; peptide; isoelectric point; posttranslational modifications; property prediction
DOI: 10.18097/BMCRM00009
pIPredict was created as a tool for prediction of the isoelectric point of peptides and proteins. It can also generate virtual 2D electrophoresis maps. The method of pI prediction is based on the Henderson-Hasselbach equation. In a new version the ProMoST and our new scales of pKa values were added. The other added features included: correction of electrophoretic shift by analyzing amino acid composition of proteins and prediction of pI values for proteins with a new set of posttranslational and other chemical modifications. Prediction of pI for proteins with PTM can be used to predict position of modified proteoforms on the virtual 2D electrophoresis map or as the tool of identifying which particular proteoform was observed in the experiment.The program also includes several widely used pKa scales, that can partially calculate values for proteins with some post-translational modifications. pIPredict is created as JAVA application and is freely available at http://www.ibmc.msk.ru/LPCIT/pIPredict.
|
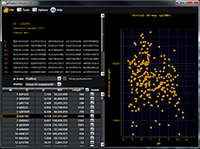
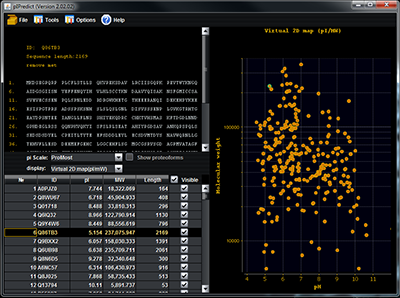
Figure 1.
Example of the pIPredict 2 GUI. 277 proteins encoded by human chromosome XVIII were loaded. In the upper left frame - the sequence of the selected protein from the list of proteins (the lower left frame). In the right frame the virtual 2D map is shown.
|
|
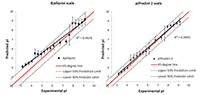
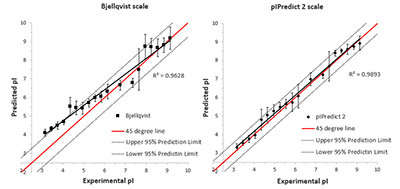
Figure 2.
Comparison of the experimental and predicted pI values for the set of 7390 peptides [5]. This set was obtained during analysis of peptides after isoelectric focusing and the experimental values were determined with accuracy ± 0.15 pH units, (or the "step" of 0.3 pH units). On the left side are shown values predicted by the widely used "Compute pI / Mw" service (https://web.expasy.org/compute_pi/). On the right side, the predictions by the new pIPredict 2 scale are shown.
|
|
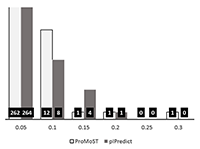
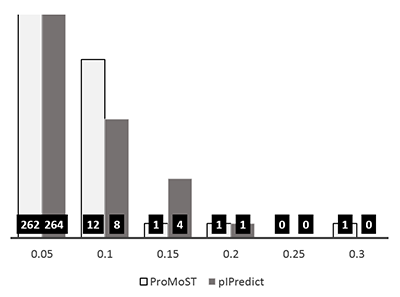
Figure 3.
Distribution of pI differences of predicted pI without and with elimination of N-terminal methionine (277 proteins encoded by human chromosome XVIII). The pKa’s scales ProMoST and pIPredict 2 were used. The group with insignificant changes (from 0 to 0.05) was removed.
|

|
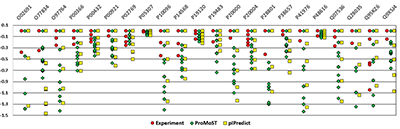
Figure 4.
An example of comparison of predicted pI values for the virtual proteoforms (probable PTMs include phosphorylation of threonine or serine residues and deamination of glutamine or asparagine residues, and their combination) with the experimentally observed proteoforms obtained by analysis of the Bos Taurus kidney tissues [9]. For these proteins several variants of the position (red points) were found. The y-axis is the shifts of proteoforms pI values (the most basic value is set as zero). The hypothesis about nature of detected variants can be made for the proteins: O02691, O77834, P10096, P14568, P41976, Q28035, Q95KZ6.
|
ACKNOWLEDGEMENTS
This work was performed within the framework of the Program for Basic Research of State Academies of Sciences for 2013-2020.
REFERENCES
- Skvortsov, V. S., Alekseychuk, N. N., Khudyakov, D. V., & Romero, I. R. (2015). pIPredict: a computer tool for predicting isoelectric points of peptides and proteins. Biomeditsinskaya khimiya, 61(1), 83-91. DOI
- Po, H. N., & Senozan, N. M. (2001). The Henderson-Hasselbalch equation: its history and limitations. Journal of Chemical Education, 78(11), 1499. DOI
- Patrickios, C. S. (1995). Polypeptide amino acid composition and isoelectric point: 1. A closed-form approximation. Journal of colloid and interface science, 175(1), 256-260. DOI
- Gauci, S., Van Breukelen, B., Lemeer, S. M., Krijgsveld, J., & Heck, A. J. (2008). A versatile peptide pI calculator for phosphorylated and N‐terminal acetylated peptides experimentally tested using peptide isoelectric focusing. Proteomics, 8(23‐24), 4898-4906. DOI
- Perez-Riverol Y., Audain E., Millan A., Ramos Y., Sanchez A., Vizcaíno J. A., Wang R., Muller M., Machado Y.J., Betancourt L.H., Padrón G., Besada V. (2012). Isoelectric point optimization using peptide descriptors and support vector machines. Journal of proteomics, 75(7), 2269-2274. DOI:10.1016/j.jprot.2012.01.029. DOI
- Skvortsov, V. S., Alekseychuk, N. N., & Rybina, A. V. (2017). Correction of the electrophoretic shift in virtual 2D SDS-PAGE electrophoresis. Biomeditsinskaya khimiya, 63(3), 278-283. DOI
- Bjellqvist B., Hughes G.J., Pasquali Ch., Paquet N., Ravier F., Sanchez J.-Ch., Frutiger, S. & Hochstrasser D.F. (1993). The focusing positions of polypeptides in immobilized pH gradients can be predicted from their amino acid sequences. Electrophoresis, 14, 1023-1031. DOI
- Halligan, B. D. (2009). ProMoST: a tool for calculating the pI and molecular mass of phosphorylated and modified proteins on two-dimensional gels. In Phospho-Proteomics (pp. 283-298). Humana Press. DOI
- Talamo, F., D'Ambrosio, C., Arena, S., Del Vecchio, P., Ledda, L., Zehender, G., Ferrara, L. & Scaloni, A. (2003). Proteins from bovine tissues and biological fluids: defining a reference electrophoresis map for liver, kidney, muscle, plasma and red blood cells. Proteomics, 3(4), 440-460. DOI