FLUOROQUINOLONE-INDUCED NAD+ DEPLETION AS A NOVEL MECHANISM OF CYTOTOXICITY
Tyumen State Medical University, 54 Odesskaya str., Tyumen, 625023; *e-mail: kowendi3@gmail.com
Keywords: fluoroquinolones, mechanism of toxicity, energy metabolism, NAD+ metabolism
DOI:10.18097/BMCRM00294
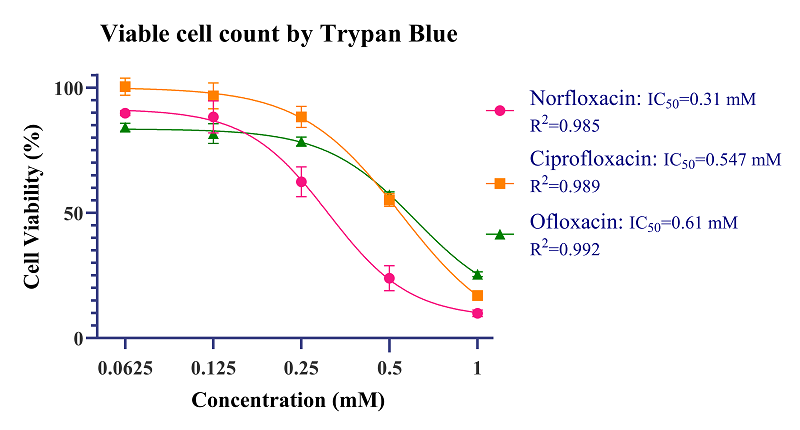
A potential mechanism for the cytotoxic and antitumor effects of fluoroquinolones has been discovered. Treatment of HCT-116wt cells with norfloxacin, ciprofloxacin, and ofloxacin decreased intracellular NAD+ and cell survival. The IC50 values for the effect of fluoroquinolones were 0.314 mM (for norfloxacin), 0.547 mM (for ciprofloxacin), and 0.612 mM (for ofloxacin). The MTT test for cytotoxicity and mitochondrial functional status assessment revealed similar IC50 values of 0.32 mM (for norfloxacin), 0.35 mM (for ciprofloxacin), and 0.67 mM (for ofloxacin). The suggest unveil a new potential mechanism of fluoroquinolone action on cells beyond their antimicrobial activity.
|
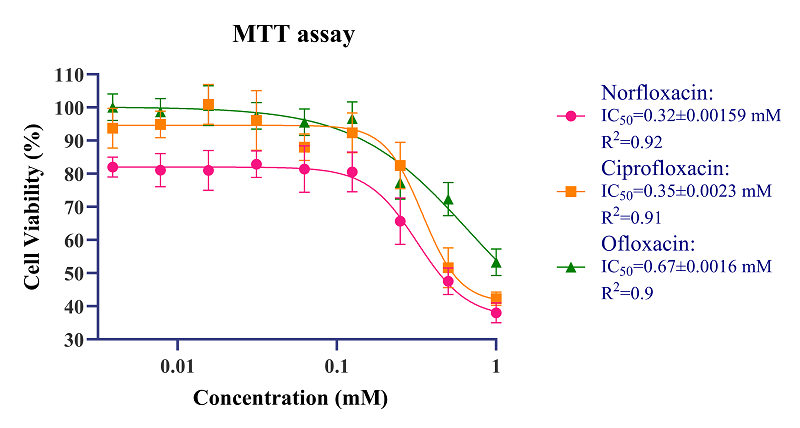
Figure 1.
Survival curves of HCT-116 wt cells after the addition of certain second-generation fluoroquinolones. The X-axis shows the concentration of fluoroquinolones in mM, and the y-axis represents the percentage of viable cells relative to the control, as counted by trypan blue exclusion. R2, the coefficient of determination.
|
|
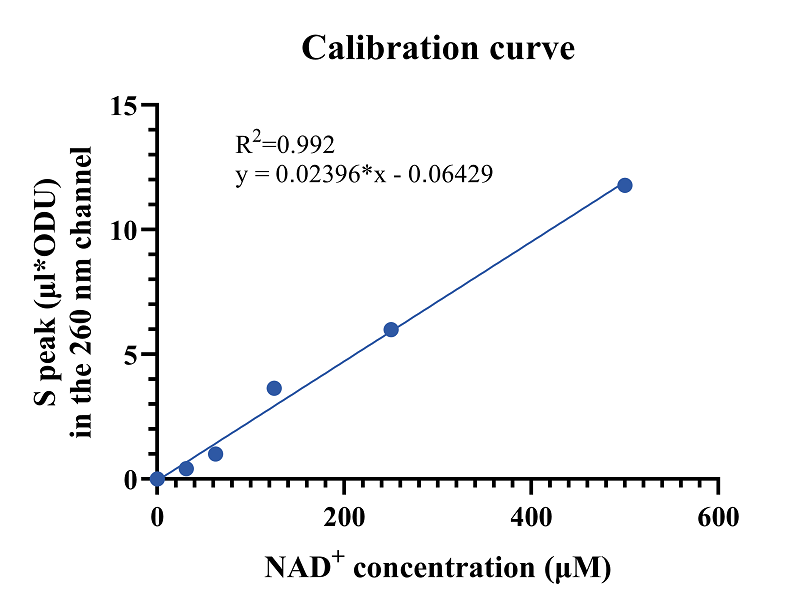
Figure 2.
Calibration curve for the analysis of NAD+ concentration in cell lysates. The X-axis shows the NAD+ concentrations (concentration range: 500 µM, 250 µM, 125 µM, 62.5 µM, 31.25 µM). The Y-axis – the peak area in µL × optical density units (ODU) at a UV detector wavelength of 260 nm. The graph also shows the equation of the calibration curve and the correlation coefficient (R²).
|
|
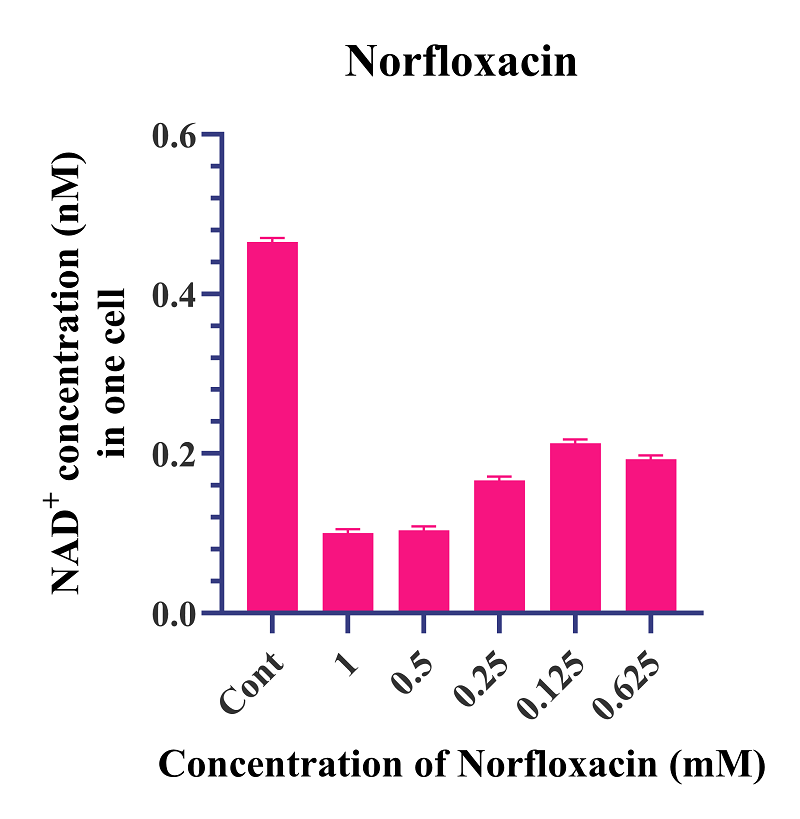
Figure 3.
Effect of norfloxacin on intracellular NAD+ levels in HCT-116wt cells. Data are presented as mean ± SD. X-axis: norfloxacin concentration in the sample (mM); Y-axis: NAD+ concentration per cell (nM). An inverse relationship between norfloxacin concentration and intracellular NAD+ level is shown.
|
|
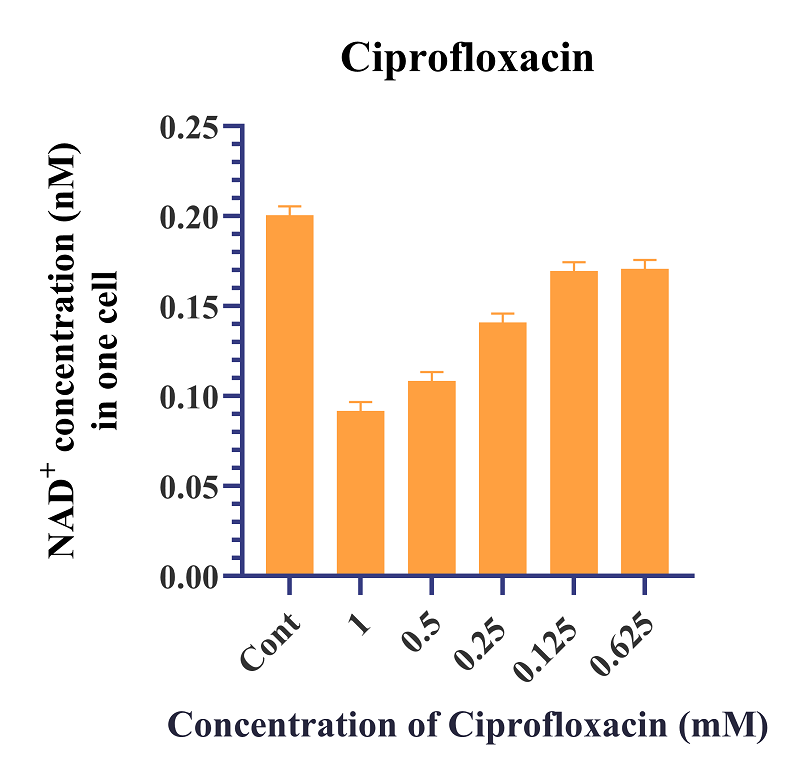
Figure 4.
Intracellular NAD+ concentration per cell after ciprofloxacin treatment. Similar to Figure 3, the graph demonstrates the concentration of NAD+ per cell (nM, y-axis) in response to varying concentrations of ciprofloxacin (mM, x-axis), showing an increase in NAD+ with decreasing antibiotic concentration.
|
|
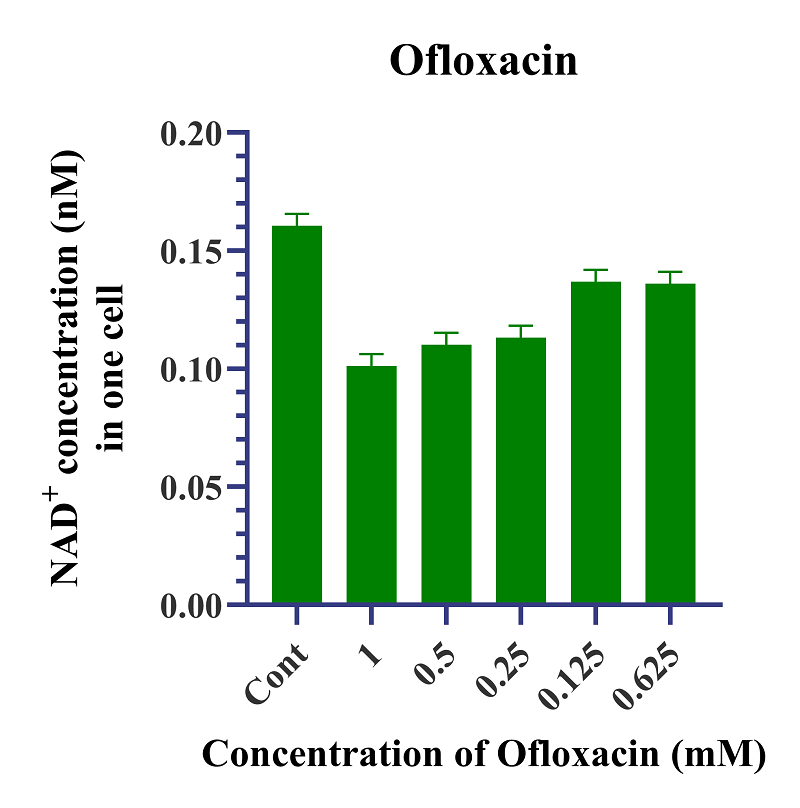
Figure 5.
Effect of ofloxacin on intracellular NAD+ levels in HCT-116wt cells. Data are presented as mean ± SD. X-axis: ofloxacin concentration in the sample (mM); Y-axis: NAD+ concentration per cell (nM). An inverse relationship between ofloxacin concentration and intracellular NAD+ level is shown.
|
|
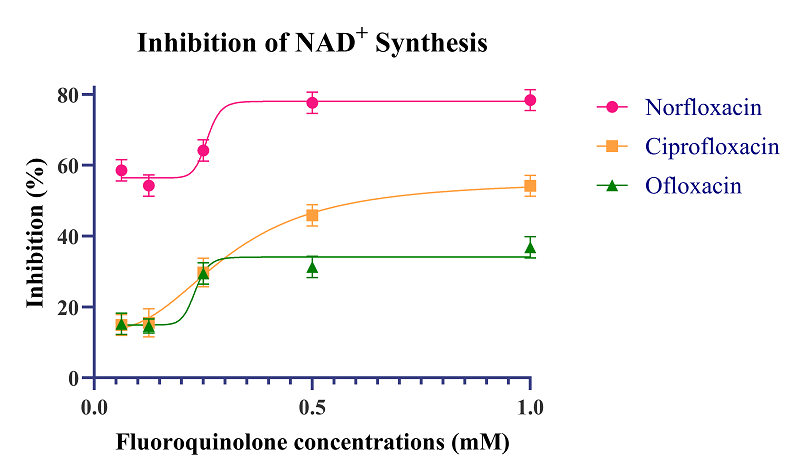
Figure 6.
Inhibition of NAD+ formation by norfloxacin, ciprofloxacin, and ofloxacin in HCT-116wt cells. Data are presented as mean ± SD. X-axis: fluoroquinolone concentration in the sample (mM); Y-axis: inhibition of NAD⁺ formation (%).
|
|
Figure 7.
Effect of norfloxacin, ciprofloxacin and ofloxacin on cell viability in the MTT test.
|
FUNDING
The study had no external funding sources.
REFERENCES
- Baggio, D.,Ananda-Rajah, M. R. (2021) Fluoroquinolone antibiotics and adverse events. Australian Prescriber, 44(5), 161–164. DOI
- Hryhoriv, H., Kovalenko, S. M., Georgiyants, M., Sidorenko, L., Georgiyants, V. (2023) A comprehensive review on chemical synthesis and chemotherapeutic potential of 3-heteroaryl fluoroquinolone hybrids. Antibiotics (Basel, Switzerland), 12,(3), 625. DOI
- Mondal, E. R., Das, S. K., Mukherjee, P. (2004) Comparative evaluation of antiproliferative activity and induction of apoptosis by some fluoroquinolones with a human non-small cell lung cancer cell line in culture. Asian Pacific Journal of Cancer Prevention : APJCP, 5(2), 196–204.
- Abdel-Aal, M. A. A., Abdel-Aziz, S. A., Shaykoon, M. S. A., Abuo-Rahma, G. E. A. (2019) Towards anticancer fluoroquinolones: a review article. Archiv der Pharmazie, 352(7), e1800376. DOI
- Nowakowska, J., Radomska, D., Czarnomysy, R., & Marciniec, K. (2024). Recent Development of Fluoroquinolone Derivatives as Anticancer Agents. Molecules (Basel, Switzerland), 29 (15), 3538. DOI
- Yadav, V., & Talwar, P. (2019). Repositioning of fluoroquinolones from antibiotic to anti-cancer agents: An underestimated truth. Biomedecine & pharmacotherapie, 111, 934–946. DOI
- Ho, F.Y., Tsang, W.P., Kong, S.K., Kwok, T.T. (2006) The critical role of caspases activation in hypoxia/reoxygenation induced apoptosis. Biochemical and Biophysical Research Communications, 345(3), 1131–1137. DOI
- Asmaa E. Kassab (2025) The most recent updates on the anticancer potential of fluoroquinolones: a mini review, Future Medicinal Chemistry, 17(16), 2067- 2078, DOI
- Yoshino, J., Imai, S. (2013) Accurate measurement of nicotinamide adenine dinucleotide (NAD+) with high-performance liquid chromatography. Methods in Molecular Biology (Clifton, N.J.), 10 (7), 203–215. DOI
- Turnidge J. (1999). Pharmacokinetics and pharmacodynamics of fluoroquinolones. Drugs, 58 (2), 29–36. DOI
- Vallet, C. M., Marquez, B., Ngabirano, E., Lemaire, S., Mingeot-Leclercq, M. P., Tulkens, P. M., & Van Bambeke, F. (2011). Cellular accumulation of fluoroquinolones is not predictive of their intracellular activity: studies with gemifloxacin, moxifloxacin and ciprofloxacin in a pharmacokinetic/ pharmacodynamic model of uninfected and infected macrophages. International journal of antimicrobial agents, 38(3), 249–256. DOI