The prediction of the isoelectric point value of peptides and proteins with a wide range of chemical modifications
Institute of Biomedical Chemistry, 10 Pogodinskaya str., Moscow, 119121 Russia; *e-mail: vladlen@ibmh.msk.su
Keywords:: peptide; isoelectric point; post-translational modifications; chemical modifications; property prediction
DOI:10.18097/BMCRM00161
The scale of virtual pKa values for calculating the isoelectric point of peptides and proteins with chemical and post-translational modifications (PTM) is presented. The learning set of pKa values is based on data from 25 experiments of isoelectric focusing of peptides with subsequent mass spectrometric identification (ProteomeXchange accession codes: PXD000065, PXD005410, PXD006291, PXD010006 and PXD017201). In order to enrich the resulting sets with peptides containing modifications the identification of peptides was repeated using raw mass spectrometry data of all datasets. In the final learning set have included peptides satisfying the following conditions: the peptide was found in the fraction with scoring function maximum and maximum peptide abundance; the peptide was found in more than one experiment, and differences of the pI value between experiments was less than 0.15 pH unit. Two variants of the scales were created. In the first variant, pKa values depended only on the residue position relative to the ends of the sequence (N- or C-terminal residue or inside the chain). In the second variant, the effect of neighboring residues was also taken into account. The prediction accuracy of the second variant was higher. The comparison with other methods of pI prediction was carried out. Although the scale was calculated from set containing only peptides, it would be applicable for pI prediction of proteins with and without PTM. The software for prediction of pI values using the resulting pKa scales is available at http://pIPredict3.ibmc.msk.ru.
INTRODUCTION
The isoelectric point (pI) is an important physical and chemical characteristic of peptides and proteins, which is widely used in the practice of modern experiments [1-2]. For example, in the field of proteomic studies, methods such as two-dimensional (2D) gel electrophoresis for proteins and peptide fractionation [3-6] using isoelectric focusing (IEF) for the following analysis by mass spectrometric methods are most commonly used. In addition, the pI value can be used as an additional marker in controlling the correct identification of peptides, rarely proteins (since proteins are largely subject to posttranslational modification (PTM), determining which specific proteoform is being studied, - is often a difficult task in itself [7]).
Two methodological approaches are commonly used to predict the pI value. The most common is the use of the Henderson-Hasselbach equation [8]. As a rule, in the case of peptides and proteins, a scale of dissociation constants (pKa) values for individual chemical groups calculated in advance is used. The most popular is the scale from [9], on the basis of which the widely used protein pI calculator [10] on the Swiss Bioinformatics Resource Portal was created. Although the authors [9] explicitly write about predicting the value in a given pH range (from 4 to 7), this fact has been forgotten over the years. The dependence of the pKa value on temperature and the ionic strength of the solution is also generally not considered (to be fair, the Chemaxon Marvin Suite [11] does consider the temperature dependence for pKa prediction). At the same time, for proteins in which potentially charged groups are abundant, the error caused by the selected scale is usually small and lies within the range of 0.5 pH units. For a wide range of applications, this accuracy may be sufficient. However, in the case of peptides with a limited number of dissociation groups, this error can be significantly higher.
There are several options for forming the scale of pKa values: quantum chemical calculations (the accuracy and time depend significantly on the complexity of the system) and on the basis of empirical data obtained by various methods. The first is titration of model peptides [12]. This is the most reliable method. However, it is long, expensive, and does not guarantee that all possible combinations are simulated when a small number of samples is used. In addition, the number of variants of model structures grows exponentially with increasing peptide length. The second method is an inverse problem solution: if pI values are known for a set of peptides (proteins), then pKa values are selected so that the mean or RMS error is minimal [13] (the mathematical method of parameter optimization may be different, up to a simple search of values). The latter method requires a set of a large number of peptides with known pI values. Such datasets are available as a "byproduct" of "shotgun" proteomics using isoelectric focusing fractionation and are widely used [2, 14, 15]. In the case of their use, the following should be taken into account:
- A large number of peptides are found in several fractions, and one must clearly understand the criteria by which a peptide is assigned a specific pI value.
- Since fractionation usually takes place within a certain pH range ("width" of the fraction is arbitrarily determined by the experimenter depending on the own task and possibilities), there is an a priori error in determining the pI for a particular peptide.
- The trypsinolysis is the main method for sample preparation for mass spectrometry analysis, so there is sample degeneracy with respect to the C-terminal amino acid residues (the vast majority are arginine and lysine).
- As a rule, the authors of papers solve their own problems, and the main task is to determine as many peptides as possible rather than the pI values themselves. The exact range of pH values for a particular fraction cannot always be ascertained from the text of the paper, since there are no markers in the sample, and the limits of the value range depend on the conditions of the experiment.
- When forming the list of peptides, only the PTMs significant for experimenters (e.g., phosphorylation, deamination, N-acetylation) are noted, while methylation, oxidation, etc. are ignored. The description of obligate chemical modifications (e.g., cysteine alkylation) may be omitted, although it is noted in the methodological part.
- Peptides with pI values less than or greater than the boundaries of the pH range of the IEF strip tend to remain in the extreme fractions, but can also be found throughout the range.
- Finally, peptide identification errors are not only possible, they are inevitably present. For example, a False Discovery Rate (FDR) value of 5% for peptides can be interpreted to mean that up to 5% of false identifications exist a priori.
Of the positive aspects of this method, the large sample size, as well as the presence of modified peptides in the samples, should be noted in the first place. This makes it possible to form a scale that takes into account posttranslational modifications, which present in a very limited number of programs (e.g., phosphorylation at [16] or chemical modifications using TMT (Tandem mass tag) and iTRAQ (Isobaric tag for relative and absolute quantitation) [14]).
In addition to the Henderson-Hasselbach equation, there is another approach for predicting pI values - the application of machine learning methods using genetic algorithms [17], artificial neural networks [13], and the support vector machine (SVM) [15, 18]. However, despite the apparent attractiveness and undoubted advantages of these methods, they also have a number of limitations and drawbacks (overtraining of the set, inability to predict pI for polypeptides that differ significantly in size from those used in the training sample, inability to adapt the model when introducing new PTM variants without complete recalculation, etc.). Something can be solved by using separate models for peptides and proteins, but there are even more problems for protein data than for peptides. Usually pI values for proteins are taken from data obtained by 2D-PAGE. It is often not known which proteoform we are talking about. Experimenters don't bother using of pH markers, and the binding to the scale is done either by known proteins or by predicted values using the pI calculator from the Swiss Bioinformatics Resource Portal website. It is not uncommon to publish data that are a compilation of several pooled experiments, and there may be errors in the "gluing" places. In any case, data sets are significantly smaller in size than for peptides.
This work is devoted to the formation of a scale of pKa values, using which pI values can be predicted for both peptides and proteins with a wide range of PTM and chemical modifications, both intentional and spontaneous, observed during mass spectrometric analysis.
METHODS
Data from mass spectrometric identification experiments using IEFs deposited to the ProteomeXchange database (accession codes: PXD000065 [14], PXD005410 [19], PXD006291 [20], PXD010006 [21], and PXD017201 [22]) were used to form the learning set. A total of 25 datasets were processed (Table 1), but not all of them were used to select the learning set for the reasons mentioned below. Since it was important for this work to obtain the maximum possible range of modifications (it was not the task of the authors of the experimental works) the peptides were identified anew using the Peaks Studio X Pro program [23]. Chemical modifications specific to a particular experiment (cysteine alkylation, TMT or iTRAQ tags), phosphorylation, methionine oxidation, and deamination were specified as the main modifications. The remaining modifications were found using the appropriate program module. The limit for precursor identification was set at 5 ppm and the accuracy of fragment identification was 0.01 Da. Peptides with an FDR of 5% were selected. Selection variants with FDR levels of 1% and 0.1% were also analyzed in the course of the work, but no significant improvement in sample quality after selection was observed with a sharp reduction in the number of variants. As a rule, each identified peptide could occur in several samples associated with different pI values. This may be due to both false identifications and to the fact that the peptide occurs in several neighboring samples with a maximum number of molecules in the sample with the pH closest to the pI of the peptide. Therefore, only those variants for which the maximum of the scoring function for peptide identification coincided with the maximum of the area under the precursor ion distribution curve on the chromatogram (this value can serve as a measure of the amount of peptide) were selected for the resulting set. A total of 613339 variants for 372216 nonrepeatable peptides were selected at the initial stage (Table 1 and supplemental materials).
|
CLOSE
|
Table 1.
Raw data sets from Protein Exchange used in this work.
|
For each peptide identified in more than one data set, the scatter of ΔpI values ranged from 0 to 8 pH units. This is partly due to the fact that the actual pH values in each particular experiment may differ from those stated by the manufacturer of the IEF strips on which the pH separation of the peptides occurs. In [14], one of the data sets was obtained using pI markers. Thus, it was possible to correct the pI values using data for peptides occurring in both this set and the one for which correction was required. An exception was dataset 15; but it was possible to align it with other datasets (dataset 16, obtained by the same authors, was used). Data sets 13 and 17 (stated pH range of 2.5-3.7) were used without alignment due to the absence of significant overlaps with other sets. It should be noted that the presence of identical peptides in data sets obtained without obligate chemical modifications and with introduced tags (or sets with different tags) is rather an artifact of sample preparation. All peptides are expected to be modified; nevertheless, there is always some fraction of unreacted peptides in the samples, and if the amount of the original peptide is large, this fraction may be sufficient for its identification in the unmodified form.
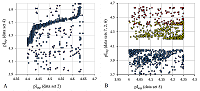
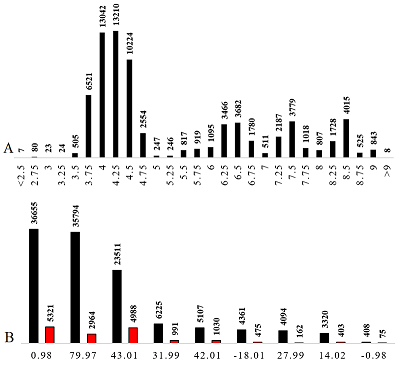
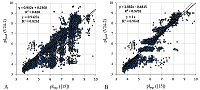
The final selection for the formation of the learning set was performed using the following rules: the peptide had to be identified in two or more data sets, whereby, if at least one of the sets had a pH range of 3 to 10, the difference in the pI values had to be no more than 0.15 pH units, for pH ranges 6-9 and 6-11, no more than 0.1, in the case where the match was only in data sets with pH ranges 3.7-4.9 and already, no more than 0.05. Data from sets 2, 5, 6, and 7 with pH value range widths less than 0.5 were excluded from the comparison. The reason was the presence of nonlinear dependences in the pairwise comparison of the sets (Fig. 1A) and the fact that they contained too many peptides for which the pI value determined in the other sets did not coincide even approximately with the declared range. Moreover, despite the fact that these 4 sets themselves close 4 ranges of pH values sequentially with little overlap along the border, a significant portion of the peptides are in more than one set and often in more than two (Fig. 1B).
|
Figure 1.
The pairwise comparison of experimentally determined pI values (pIexp) for the peptides available in each of the sets. A. Set 2 versus set 4. B. Set 2 (red), 6 (yellow), and 7 (blue) relative to set 5.
|
For each specific peptide, the median value of all existing variants was taken as the pI value. The generated learning set contains 73863 peptides (see supplemental materials); the distribution of pI values and the number of peptides with the most represented modifications are shown in Fig. 2 (full statistics for all modifications are given in supplemental materials).
|
Figure 2.
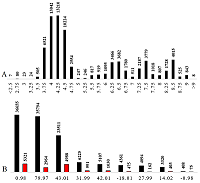
Characteristics of the learning set. A. The distribution of the number of peptides by pIexp value. B. The comparison of the original (black) and the learning set (red) for the total number of the most common modifications without cysteine alkylation, TMT, or iTRAQ tags (residue mass change indicated, see supplemental materials for full statistics).
|
The formation of the pKa value scale and testing
Two variants of the pKa value scale were investigated in the course of this work. The first, similar to the scale we published earlier [13], in which pKa values differ for residues located at the N- and C-ends of the peptide and residues from the second to the penultimate (we denote it as scale 3). The second option involves taking into account the influence of neighboring residues. Ideally, all possible variants of neighboring residues should be varied, but this is impossible for the set of less than 74 thousand observations, because the number of variants is too large (especially taking into account PTMs and chemical modifications). To reduce the number of variants for neighboring residues, we introduced a division into 4 groups: 1 - the residue has no dissociable groups; 2 - the residue has protonated groups; 3 - the residue has dissociable groups; 4 - the residue has both protonated and dissociable groups. Thus, 24 variants of constants are possible for each residue type (scale 24), and although there can be up to 3 pKa and up to 3 pKb values for each residue, the real number of variables in the scale is 1740. The number of variables was also reduced by the fact that when the modification refers to the N- or C-terminal residue and the formation of an amide bond takes place (for example, TMT or iTRAQ), such a modification is treated as an independent residue, and the amino acid residue is attributed as an internal one.
Usually, for testing, the set is divided into two parts: a learning and a test set, but the set of 73863 observations is not too large, especially for scale 24. Therefore, all peptides in all 25 data sets not included in the learning set were considered as test peptides. Although the number of misidentifications and misidentified pI values was higher there, the vast majority of peptides were identified correctly, as were the pI values in a significant number of cases. A measure of this can be the percentage of predictions that coincide with those determined experimentally. In addition, a comparison was made with the data obtained by the various methods given in [15]. Prediction quality testing for proteins was performed on sets from [15, 24]. Data from the latter were downloaded from the World-2DPAGE Repository (https://world-2dpage.expasy.org/repository/) [25].
Optimization of the pKa values in the scales was performed using the Monte Carlo method (up to 100,000 iterations) followed by a oneordinate simple optimization procedure (independently for each of the pKa values). The mean absolute prediction error (MAE) was used as the optimized parameter. The procedure for all pKa values was repeated cyclically up to 100 times or until changes in the optimized value ceased. The pI values of the optimization were calculated numerically (accuracy to 0.001 of pH) using the Henderson-Hasselbach equation:
| $$cl=\sum_i{\ {{{Nb}_i\ \cdot {\ 10}^{-pH}}\over {{10}^{-pH}\ +\ {10}^{{-pKb}_i}}}+\ \sum_i{{{{Na}_i\ \cdot {\ 10}^{-pH}}\over {{10}^{-pH}\ +\ {10}^{{-pKa}_i}}}}-{Na}_i}$$ |
|
RESULTS AND DISCUSSION
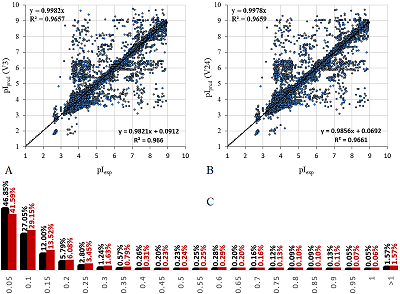
As a result of the optimization, the minimum MAE for scales 3 and 24 was 0.128 and 0.123 pH units. The quality of the prediction of pI values using the learning set can be evaluated in Figure 3. The R2 values of the learning are shown in the diagrams in two variants with and without the constant. It is difficult to tell from the charts what the advantage of scale 24 is, but this can be seen from the distribution of AE (Figure 3C). The quality of prediction for outliers (which, following [15], are taken as values of AE exceeding 0.25) is not particularly affected by the detail of the scale, but for some peptides with AE within 0.25, the pI value is predicted more accurately (10% more falls within the limit to 0.05). There cannot be more differences between the scales, because in fact the difference of the second one is important only for cases where there are charged residues nearby, and most of the amino acid residues do not have charged groups. Not all of the 24 variants had enough observations for each type of residue. In this case, the missing values were supplemented by using the averaged value for other types of residues similar in the spectrum of dissociated and protonated groups. This is important for predicting peptides not included in the learning set.

|
Figure 3.
The comparison of learning results without (A, red bars in the histogram) and including (B, black) neighboring residuals. C. The distribution of peptides by absolute error of prediction in learning.
|
The test results for all 25 datasets are presented in Table 2.
|
CLOZE
|
Table 2.
The distribution (%) of peptides not included in the training sample by absolute prediction error of pI. The scale with neighboring residuals taken into account was used
|
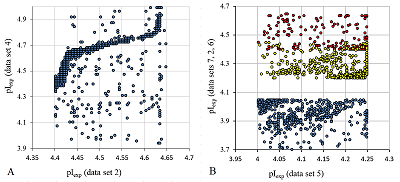
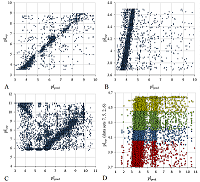
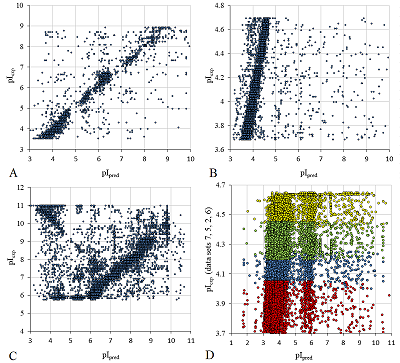
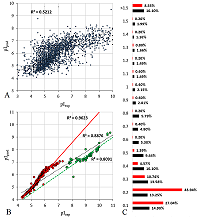
When predicted for data sets 2, 5-7, 40% to 60% of the observations fall within a region with an AE of less than 0.25, and in the plot combining all 4 sets (Figure 4D) we can see a general band corresponding to an area of peptides positioned according to their pI, and a plume of peptides with more basic pI that did not come out outside the IEF stripe. For all data sets ranging from pH 3 to 10 (example in Figure 4A), the number of outliers did not exceed 32% in the worst case (recall that they were all depleted of "correct" values). Data sets 13 and 17 were not aligned with the others and yet have a rather narrow range of pI values. Since for these sets there is a maximum on the AE distribution plot around 0.2-0.25, it is very likely that there is a systematic error in determining the pH range. Sets 1 and 18 (Fig. 4B) contain peptides with the iTRAQ label, and the learning set included less than 10% of the total number of such peptides, yet they have the best prediction result. Separately, we should note the data for sets 24 (Fig. 4C) and 25. We cannot explain the presence in them of large groups of peptides, for which pI is predicted exactly at a 90-degree angle to the main trend, by anything other than the presence of contaminants. With a little knowledge of the practice of such experiments, the presence of such contaminants can be assumed for set 25, whose data for individual slices are presented in reverse order (from a larger pI value to a smaller one). But since the exact order of mass spectrometric analysis of the samples is unknown, it is impossible to make a specific conclusion about the possibility of such contamination. On average, even when sets 13 and 17 are considered, the AE of prediction for 77% of the peptides is within up to 0.25 pH units (if the pI value for a particular peptide is taken as the median value over all data sets).
|
Figure 4.
The comparison of experimental pI values of peptides not including in the training sample with pI values predicted by the scale with neighboring residuals accounting. A. Set 19. B. Set 18. С. Set 24. С. Set 2 (yellow), 5 (blue), 6 (green), and 7 (red).
|
A comparison of the quality of predictions using scale 24 with predictions using scales of other authors can be made using data from [15], which compares our own SVM-based method with a large number of scale variants for calculations using the Henderson-Hasselbach equation. All prediction data for a set of 25% test peptides, except for ours, are taken from the supplementary files of [15]. The distribution of the mean error and R2 are shown in Table 3. Only the top 5 methods using the Henderson-Hasselbach equation were included in the table. At first sight, our scale (column V24-1 in the table), in spite of the formally worse R2 value by the distribution of the absolute error and the number of outliers (according to [15], values differing by more than 0.25 pH values are taken as such), gives results comparable to methods using the Henderson-Hasselbach equation, but loses when compared to predictions obtained using SVM. However, in [15] the same datasets were used to form the learning and test sets, which are among those used in this paper [14, 21]. Both works indicate that the samples were treated with iodacetamide, and in [21] TMT tags were also used. These facts are not mentioned in the description of the sets in [15]. If we replace all cysteine residues with carbamidmethylcysteine (+57.02 Da) and add TMT (+229.16) to peptides with pIexp greater than 5 (data from [14] and [21] have overlap in the range from 3 to 4.9, in which peptides can be either with or without TMT), then the result (column V24-2) becomes comparable to the IPC2 results.
|
CLOSE
|
Table 3.
The distribution of peptides from the 25% test sample of work [15] by absolute error of predicted of pI. V24 - scale variants including influence of neighboring residuals obtained in the present work.
|
For clarity, the changes in the predicted pI values with and without PTM are shown in Figure 5. It should be noted that using the pKa scale fitting technique described above and the learning set from [15], more better result (column V24-3) can be obtained for predicting test set pI values. However, it can be used for prediction only for peptides with obligate modifications (carbamidmetylcysteine and TMT labels).

|
Figure 5.
The comparison of predicted pI values (pIpred) with experimentally determined (pIexp) for peptides from the 25% test set of work [15]. A. Scale 24 without taking into account the presence of chemical modifications of the peptides have used. B. Scale 24 with chemical modifications have used.
|
The prediction of pI for peptides is a rather specific task, much more often it is necessary to predict pI for proteins. Prediction results using scale 24 for two sets of proteins are shown in Figure 6. Since, in contrast to [15], the set with proteins in any part of it was not used as a learning set, the whole set was used for prediction instead of the 25% part in order to get a more complete picture (Fig. 6A). In [15], for the 25% set, the best R2=0.59 (for the method based on the Henderson-Hasselbach equation and without learning on the protein set 0.52), with the lowest number of outliers (absolute error >0.5) being 247 (43%). Using our scale on a set four times larger, R2 = 0.52, and the number of outliers was 1052 (46%). This set is a collection of data obtained by different researchers. In [15], if there were several pI values for one identified protein, the average value was taken. The specific proteoform was not known in advance. Figure 6B shows the prediction results for Staphylococcus aureus proteins [24] obtained by the same group (in two experiments with different pH ranges). In this case, too, the probability that the proteins have PTM is much lower than in eukaryotic cells. Accordingly, the prediction result is much better, although the fact that the results were obtained by analyzing two IEFs and it's clearly visible.

|
CONCLUSION
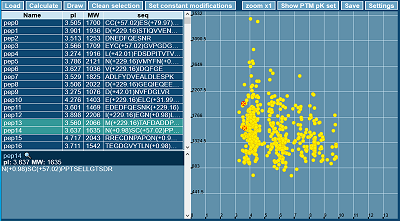
The resulting scales can be used both to predict the pI value of peptides with or without modifications and to predict the pI of proteins with some PTMs and chemical modifications. Two versions of the program were created to use these scales. The first one (written in JavaScript) has a graphical user interface (Fig. 7), works as a WEB application and is available at http://pIPredict3.ibmc.msk.ru. For this variant there is a limit of 1000 proteins (peptides) in the downloaded set size. If there is a record with a modification that is not available in the scale, this residue can be ignored or considered unmodified. The second option is an executable program for win32 written in C++, works from the command line and has no limitations on the number of proteins (peptides). The program is available in the supplementary materials to the article. In case of "unknown" modification, the residue is ignored. A description of possible modifications and data sets used in the work is also available in the supplementary materials.

|
Figure 7.
Graphic interface of the pIPredict 3 program with an example of predicting of pI values for a set of 500 peptides with modifications.
|
FUNDING
The work was done in the framework of the Russian Federation fundamental research program for the long-term period for 2021-2030.
Supplementary materials are available at http://dx.doi.org/10.18097/BMCRM00161
REFERENCES
- Giglione, C., Boularot, A., Meinnel, T. (2004) Protein N-terminal methionine excision. Cellular and Molecular Life Sciences CMLS, 61, 1455–1474. DOI
- Heller, M., Ye, M., Michel, P.E., Morier, P., Stalder, D., Jünger, M.A., Aebersold, R., Reymond, F., Rossier, J. (2005) Journal of proteome research, 4(6), 2273-2282. DOI
- Pernemalm, M., & Lehtiö, J. (2013) A novel prefractionation method combining protein and peptide isoelectric focusing in immobilized pH gradient strips. Journal of proteome research, 12(2), 1014–1019. DOI
- Zhu, M., Rodriguez,R., Wehr, T. (1991) Optimizing separation parameters in capillary isoelectric focusing. Journal of chromatography, 559, 479–488.
- Kirkwood, J., Hargreaves, D., O'Keefe, S., & Wilson, J. (2015) Using isoelectric point to determine the pH for initial protein crystallization trials. Bioinformatics (Oxford, England), 31(9), 1444–1451. DOI
- Branca, R. M., Orre, L. M., Johansson, H. J., Granholm, V., Huss, M., Pérez-Bercoff, Å., Forshed, J., Käll, L., & Lehtiö, J. (2014) HiRIEF LC-MS enables deep proteome coverage and unbiased proteogenomics. Nature methods, 11(1), 59–62. DOI
- Naryzhny, S. N., Legina, O. K. (2019) Structural-functional diversity of p53 proteoforms. Biomeditsinskaya khimiya, 65(4), 263-276. DOI
- Po, H. N., Senozan, N. M. (2001) The Henderson-Hasselbalch Equation: Its History and Limitations. Journal of Chemical Education, 78, 1499-1503. DOI
- Bjellqvist, B., Hughes, G. J., Pasquali, C., Paquet, N., Ravier, F., Sanchez, J. C., Frutiger, S., & Hochstrasser, D. (1993) The focusing positions of polypeptides in immobilized pH gradients can be predicted from their amino acid sequences. Electrophoresis, 14(10), 1023–1031. DOI
- Gasteiger, E., Hoogland, C., Gattiker, A., Duvaud, S., Wilkins, M. R., Appel, R. D., Bairoch, A. (2005) The Proteomics Protocols Handbook, pp. 571-607. DOI
- Chemaxon, Budapest, Hungary, http://www.chemaxon.com
- Patrickios, C. S. (1995) Journal of Colloid and Interface Science, 175, 256-256. DOI
- Skvortsov, V. S., Alekseychuk, N. N., Khudyakov, D. V., Romero Reyes, I. V. (2015) pIPredict: a computer tool for predicting isoelectric points of peptides and proteins. Biomeditsinskaya khimiya, 61(1), 83-91. DOI
- Branca, R., Orre, L., Johansson, H., Granholm, V., Huss, M., Pérez-Bercoff, A., Forshed, J., Käll, L., Lehtiö, J. (2014) HiRIEF LC-MS enables deep proteome coverage and unbiased proteogenomics. Nat Methods, 11, 59–62. DOI
- Kozlowski, L. P. (2021) IPC 2.0: prediction of isoelectric point and pKa dissociation constants. Nucleic Acids Research, 49(W1, 2), W285–W292. DOI
- Halligan, B. D., Ruotti, V., Jin, W., Laffoon, S., Twigger, S. N., & Dratz, E. A. (2004) ProMoST (Protein Modification Screening Tool): a web-based tool for mapping protein modifications on two-dimensional gels. Nucleic acids research, 32(suppl_2), W638-W644. DOI
- Cargile, B. J., Sevinsky, J. R., Essader, A. S., Eu, J. P., & Stephenson, J. L., Jr (2008) Calculation of the isoelectric point of tryptic peptides in the pH 3.5-4.5 range based on adjacent amino acid effects. Electrophoresis, 29(13), 2768–2778. DOI
- Perez-Riverol, Y., Audain, E., Millan, A., Ramos, Y., Sanchez, A., Vizcaíno, J. A., Wang, R., Müller, M., Machado, Y. J., Betancourt, L. H., González, L. J., Padrón, G., & Besada, V. (2012) Isoelectric point optimization using peptide descriptors and support vector machines. Journal of proteomics, 75(7), 2269–2274. DOI
- Panizza, E., Branca, R. M. M., Oliviusson, P. et al. (2017) Isoelectric point-based fractionation by HiRIEF coupled to LC-MS allows for in-depth quantitative analysis of the phosphoproteome. Scientific Reports, 7, 4513. DOI
- Zhu, Y., Orre, L. M., Johansson, H. J. et al. (2018) Discovery of coding regions in the human genome by integrated proteogenomics analysis workflow. Nat Commun, 9, 903. DOI
- Panizza, E., Zhang, L., Fontana, J. M., Hamada, K., Svensson, D., Akkuratov, E. E., Scott, L., Mikoshiba, K., Brismar, H., Lehtiö, J., & Aperia, A. (2019) Ouabain-regulated phosphoproteome reveals molecular mechanisms for Na+, K+-ATPase control of cell adhesion, proliferation, and survival. FASEB journal : official publication of the Federation of American Societies for Experimental Biology, 33(9), 10193–10206. DOI
- Babačić, H., Lehtiö, J., Pico de Coaña, Y., Pernemalm, M., & Eriksson, H. (2020) In-depth plasma proteomics reveals increase in circulating PD-1 during anti-PD-1 immunotherapy in patients with metastatic cutaneous melanoma. Journal for immunotherapy of cancer, 8(1), e000204. DOI
- Ma, B., Zhang, K., Hendrie, C., Liang, C., Li, M., Doherty-Kirby, A., & Lajoie, G. (2003) PEAKS: powerful software for peptide de novo sequencing by tandem mass spectrometry. Rapid communications in mass spectrometry : RCM, 17(20), 2337–2342. DOI
- Plikat, U., Voshol, H., Dangendorf, Y., Wiedmann, B., Devay, P., Müller, D., Wirth, U., Szustakowski, J., Chirn, G. W., Inverardi, B., Puyang, X., Brown, K., Kamp, H., Hoving, S., Ruchti, A., Brendlen, N., Peterson, R., Buco, J., Oostrum, J. v., & Peitsch, M. C. (2007) From proteomics to systems biology of bacterial pathogens: approaches, tools, and applications. Proteomics, 7(6), 992–1003. DOI
- Hoogland, C., Mostaguir, K., Appel, R. D., & Lisacek, F. (2008) The World-2DPAGE Constellation to promote and publish gel-base d proteomics data through the ExPASy server. Journal of proteomics, 71(2), 245–248. DOI