|
THE DOWNSTREAM EXTENSION OF THE CORE SEQUENCE OF T7 PROMOTER IN NASBA PRIMER DESIGN: THE IMPACT ON EFFICACY OF AMPLIFICATION
1Institute of Biomedical Chemistry, 10 Pogodinskaya str., Moscow, 119121 Russia; *e-mail: khmelevaswetlana@yandex.ru Key words: NASBA, T7 promoter, primer design, amplification efficacy DOI: 10.18097/BMCRM00302 INTRODUCTION Over the past two decades, methods collectively referred to as “isothermal amplification of nucleic acids” have emerged as a promising complement to polymerase chain reaction (PCR) [1, 2]. Unlike PCR, these methods allow for rapid and efficient amplification at a constant temperature. This significantly reduces technical requirements for equipment and, consequently, makes isothermal amplification methods most suitable for on-site DNA diagnostics [3]. The growing public awareness on biosafety issues [4, 5] and, especially, the recent SARS-CoV-2 pandemic further boosted the interest to the on-site DNA diagnostics in general and the isothermal amplification of nucleic acids in particular [6, 7]. Among methods of isothermal amplification, NASBA (Nucleic Acid Sequence Based Amplification) stands out by its ability to amplify RNA targets with RNA amplicons as an output [8] thus making NASBA a competitive method for particular applications in on-site detection of infectious agents [9]. First introduced in 1991 by J. Compton [10], NASBA relies on a concurrent action of three enzymes, viz. reverse transcriptase, RNase H, and T7 RNA polymerase, and two DNA primers usually designated as P1 and P2. The P1 primer consists of two sections: one is complementary to a segment of a RNA target and another contains a variant of T7 RNA polymerase promoter that allows for production of RNA amplicons in the course of NASBA [8]. As a rule, variants of the T7 RNA polymerase promoter used in design of P1 primer for NASBA comprise the 17-nucleotide sequence TAATACGACTCACTATA, referred to as a “core sequence” (hereinafter, all sequences are shown in the 5′-to-3′ direction). The transcription initiation site is located right after the core sequence from the 3′-end (position +1) and always starts with a guanidine nucleotide. It is common to include the 5-nucleotide sequence AATTC upstream the core sequence (positions –22 to –18) to enhance the efficiency of amplification, although NASBA can in general proceed without this sequence [11]. The region between the core sequence and the sequence complementary to the RNA target varies in sequence and length in P1 primers. The most researchers add sequences like GGG [12-16], GGGAGG [17, 18], GGGAGA [19], GGGAGAG [20], or even GGGAGAAGG [21, 22]. Presently, there is no commonly accepted rationale as to which of these particular inserts downstream of the core sequence are to be used in designing an efficient P1 primer. In contrast to NASBA, considerable efforts have been made to optimize the T7 promoter sequence for in vitro transcription in production of RNA therapeutics or proteins in cell-free systems [23-27]. In the comprehensive study by [25], the downstream extensions of the core sequence for the T7 promoter have been analyzed by using randomized DNA templates. It has been revealed that guanidine nucleotides are strongly required at positions +1 to +3 for effective transcription. Furthermore, 5-nucleotide sequences from position +4 to +8 downstream of the transcription start site strongly affected in vitro transcriptional activity, while downstream sequences starting from position +9 had no appreciable effect [25]. The goal of the present study was to test whether the findings by Conrad et al. [25] can be implemented in NASBA primer design to improve the efficacy of amplification. To achieved the goal, the NASBA-based assay for detection of bacterial pathogen Clavibacter sepedonicus [28] was selected as an experimental system. The twelve variants of P1 primer, differing by a composition of 5-nucleotide insert between positions +4 to +8, were tested. The sequences of the inserts were systematically varied so to evenly cover the expected range of in vitro transcriptional activity, from the lowest to the highest. METHODS 1.1 Bacteria culturing and RNA isolation Stain 1405 of C. sepedonicus was received from the All-Russian Collection of Microorganism (Puschino, Moscow Region, Russia). Bacteria were grown at 28°C overnight on agar medium with the following composition: 15 g/l of agar, 10 g/l of casein-peptone, 5 g/l of the yeast extract (all from Becton Dickinson, USA), 5 g/l of glucose (Fluka, Switzerland), 5 g/l of NaCl (Merck, Germany), pH 7.0–7.2. Bacteria were harvested from the agar plates and resuspended in distilled water. Total RNA was isolated from bacteria with the Total RNA Isolation Mini Kit (Agilent, USA). The bacterial pellet was first resuspended in 100 µl of the lysis solution (LS) containing 3 g/l of lysozyme (Merck) dissolved in TE-buffer (10 mM Tris-HCl, 1 mM EDTA, pH 8.0) and the suspension was incubated at the ambient temperature for 30 min, following the manufacturer’s suggestion for RNA extraction from gram-positive bacteria. The further steps of RNA isolation were carried out according to manufacturer's protocol. RNA concentrations were measured on a Qubit 4.0 fluorimeter with the Qubit RNA BR Assay Kit (Thermo Fisher Scientific, USA). The extracted RNA in nuclease-free water was aliquoted and stored at –80°C. 1.2. NASBA NASBA reactions were performed with the commercial NASBA kit manufactured by AmpliSence (Russia) for detection of Chlamydia trachomatis. Only the part of the kit was used, namely the tubes with lyophilized enzyme mixtures, tubes with lyophilized nucleotides and corresponding rehydration buffers. The tubes with primers and probes specific for C. trachomatis were discarded. Primers and the fluorescently-labelled probe (molecular beacon), targeting 16S rRNA of C. sepedonicus were chemically synthesized and HPLC-purified by Lumiprobe (Russia). The P1 primer sequences are given in Table 1. The probe sequence was FAM-GCCAGGAACGTGCAGAGATGTGCGCCCCTGGC-BHQ1, where FAM and BHQ1 were 6-carboxyfluorescein dye and fluorescence quencher (Black Hole Quencher 1), respectively. The NASBA reaction mixtures were prepared following the manufacturer’s instruction. Briefly, lyophilized nucleotides were dissolved with 86 µl of the corresponding rehydration buffer and then 8 µl of 10 µM probe solution were added. The prepared mixture was divided into 10 aliquots and placed in PCR tubes. To each tube, 1.6 µl of a mixture of fluorescently-labelled probe (concentration of 1 µM) primer P2 (CGATGCAACGCGAAGAAC) and one of the primers P1 (Table 1), containing 5 µM of each primer, was added. Then a 4 µl aliquot of the RNA sample properly diluted with nuclease-free water (or nuclease-free water for no template control, NTC) was added to each tube, so that each tube with RNA contained 0.1 pg of C. sepedonicus total RNA (corresponding to 10,000 copies of 16S ribosomal RNA per tube [29]). The tubes were incubated at 65°C for 5 min and then at 41°C for 4 min. Meanwhile, the lyophilized enzyme mixture was dissolved with 50 µl of the corresponding rehydration buffer and incubated for 15 min at ambient temperature. Afterwards, a 5 µl aliquot of the dissolved enzyme mixture was added to each PCR tube containing the mixture of nucleotides, primers, probe, and RNA solution. The tubes were placed into a DTprime5 thermal cycler (“DNA-technology”, Russia) equipped with an optical system for the real-time detection of fluorescence. The reaction was carried out for 90 min at 41°C, with measuring fluorescence intensity every 30 s (cycle). For each probe tested, the thermal cycler software automatically provided a value of Cp (crossing point) in the number of cycles, based on kinetics of fluorescence increase.
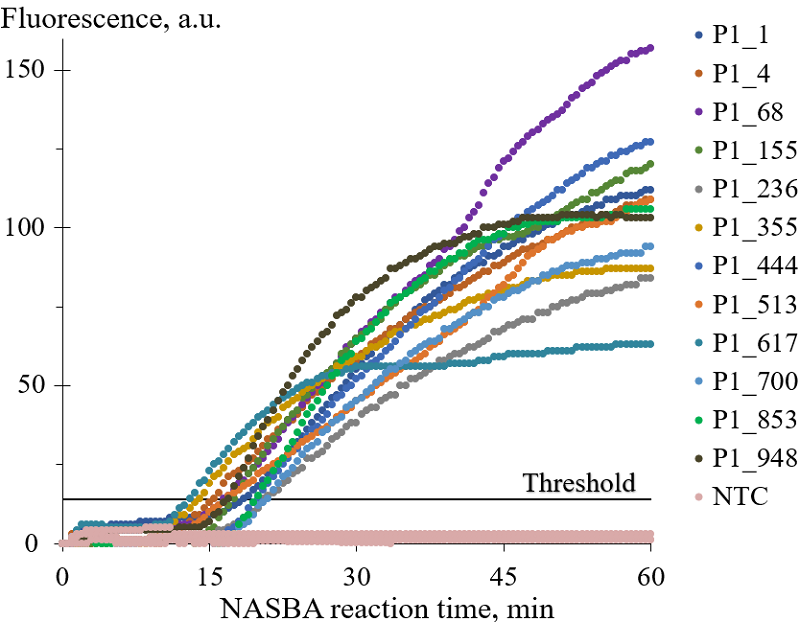
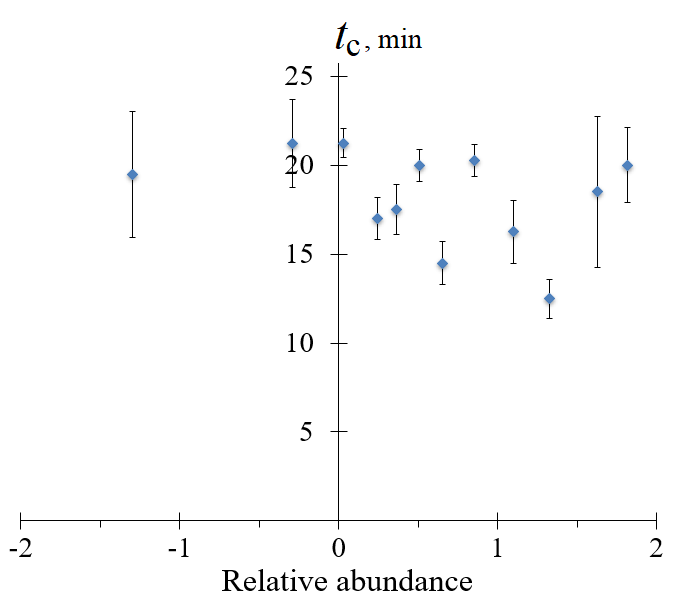
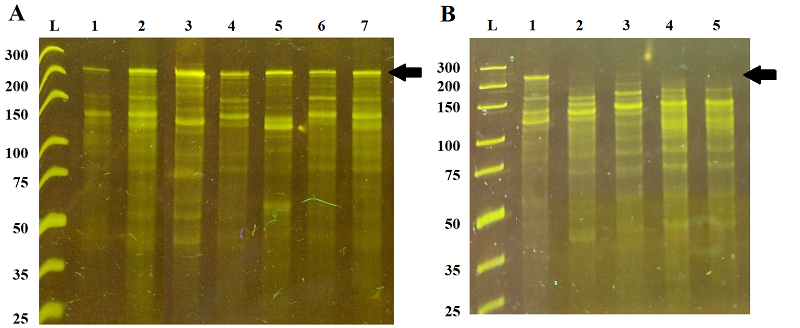
1.3. Gel electrophoresis and RNA yield quantification RNA amplicons generated by NASBA were subjected to electrophoresis under denaturing conditions in 12% (20 M of formamide) polyacrylamide gel in TBE buffer (89 mM tris(hydroxymethyl)aminomethane, 89 mM boric acid, 2 mM ethylenediaminetetraacetic acid, pH 8.3), using a Mini-PROTEAN Tetra Cell electrophoresis system (“Bio-Rad”, USA). An aliquot of each completed NASBA reaction was diluted twenty-fold with 75% formamide solution and 1 µl of the dilution was loaded into a gel well. Electrophoresis was carried out for 80 min with a voltage of 30 V per cm of gel. The gels were scanned on a Typhoon FLA 9500 Gel Imager (“GE Healthcare”, USA) after staining with 1× solution of SYBR Gold fluorescent dye in TBE buffer (“Thermo Fisher Scientific”). The GeneRuler Ultra Low Range DNA Ladder (“Thermo Fisher Scientific”) was used as a size standard. The fluorescence of RNA amplicons in each electrophoretic band was quantified as an area under the corresponding fluorescence peak (in arbitrary units), using the automated image analysis software ImageQuant TL (“Cytiva”, USA). To quantify the overall RNA yield in NASBA reaction in mass units, the RNA concentration in a completed NASBA reaction was determined on a Qubit 4.0 fluorimeter with the Qubit RNA BR Assay Kit. 1.4. Statistical treatment The arithmetic means and the corresponding standard deviations were calculated using statistical functions of the Microsoft Excell software. The calculations were based on results of 3 to 5 independent experiments. METHODS Fig. 1 shows representative amplification curves obtained with the P1 primer variants listed in Table 1. For ease of comparison, NASBA kinetics was described by characteristic amplification time tc which was calculated based on Cp values provided by the thermal cycler software (in the number of cycles) and the known cycle duration (time period between consecutive measurements of fluorescence intensity). In Figure 2, tc values for P1 primer variants were plotted as a function of “relative abundance” (Table 1). The relative abundance is a characteristic of each P1 primer used and was taken from the work by Conrad et al. [25]. It is a decimal logarithm of a ration of the number of RNA molecules synthesized on a DNA template with a particular 5-nucleotide insert (positions +4 to +8) to the number of copies of this DNA template. In fact, the relative abundance value shows how effectively a given DNA template was transcribed into RNA in the course of in vitro transcription. As seen from Figures 1 and 2, there is no clear dependence of NASBA kinetics on the values of relative abundance, and, subsequently, the sequence of the insert.
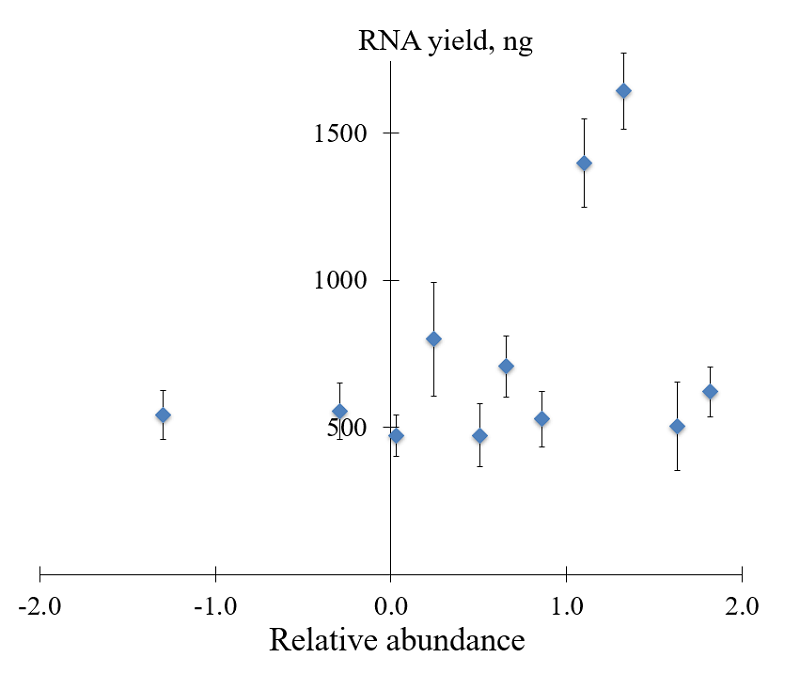
The overall yield of RNA in NASBA reaction as a function of the relative abundance is given in Figure 3. Two P1 primers demonstrated a noticeable increase of RNA yield, viz. primers P1_68 and P1_155 with extensions GGGAGAAG and GGGAGTTG right downstream the core sequence of T7 promoter (Table 1). The most promising primers, P1_1 and P1_4, with relative abundance values of 1.63 and 1.82, showed no appreciable differences in RNA yield, compared to primers P1_853 and P1_948 which were expected to perform the worst (relative abundance values –0.29 and –1.30, respectively; Table 1). However, as revealed by electrophoretic analysis of NASBA products (Fig. 4), the pool of RNA amplicons was comprised of not only the target (specific) amplicons but also RNA molecules of smaller sizes, probably the truncated specific amplicons or products of unspecific amplification. Moreover, for some variants of P1 primer (e.g., primers P1_617, P1_700, P1_853, P1_948), the target amplicons were not observed at all despite the appreciable RNA yield (Figs. 3 and 4).
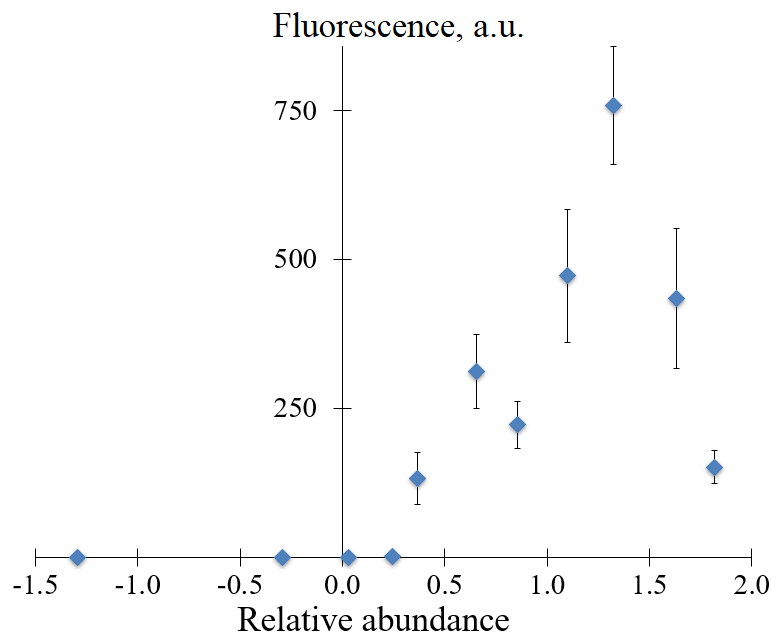
Figure 5 demonstrates the yield of target amplicons as a function of the relative abundance. Clearly, their yield in NASBA is markedly influenced by a sequence of the 5-nucleotide insert at positions +4 to +8. The primer P1_68 characterized by the relative abundance value of 1.33 showed the best result (Fig. 5). There is a strong increase in the yield of target amplicons for variants of P1 primers with inserts characterized by relative abundance values between 0.25 and 1.33. However, for two variants of P1 primer with higher relative abundance values, P1_1 and P1_4, the obvious decline in the yield of target amplicons was observed (Fig. 5).
The results obtained indicate that the ranking of 5-nucleotide sequences (positions +4 to +8, Table 1) based on their performance in in vitro transcription [25] can provide a helpful guide in designing NASBA primers, but this ranking has to be used with caution. Compared to in vitro transcription, where pre-made double-stranded DNA (dsDNA) is commonly utilized as a template, dsDNA templates in NASBA are synthesized in the course of amplification. Their synthesis requires the priming of P1 and P2 primers to single-stranded DNA and RNA templates [8]. Only the first priming events occur at the elevated temperature of 65°C while a majority of priming events occurs at the rather low reaction temperature of 41°C. At such a temperature, single-stranded primers can be especially prone to base-pairing of complementary segments within their sequences. This can lead to an undesirable formation of homo- and heterodimeric as well as hairpin-like structures by primers and potentially interfere with their priming, thus affecting the NASBA performance. Interestingly, the variations in sequences of the 5-nucleotide inserts in primers P1_1, P1_4, and P1_68 (Table 1) do influence the primers’ ability to form unwanted structures in different ways, as evaluated with the IDT OligoAnalyzer tool (https://eu.idtdna.com/pages/tools/oligoanalyzer, last accessed on September 10, 2025). The primer P1_68 which has performed the best in NASBA (Fig. 4 and Table 1) was able to form only one hairpin-like structure with melting temperature (Tm) above the NASBA reaction temperature. The predicted Tm value for that hairpin-like structure was 44.9°C. In contrast, both primer P1_1 and primer P1_4 were able to form two hairpin-like structures with predicted Tm = 46.4°C and 44.0°C (P1_1) and Tm = 46.4°C and 46.3°C (P1_4). Furthermore, unlike the primers P1_4 and P1_68, the 4-nucleotide stretch AATA of the 5-nucleotide insert in primer P1_1 (Table 1) was capable of pairing with the stretch TATT in the core sequence of another primer P1_1. This resulted in formation of the additional primer’s homodimeric structure with Gibbs energy of –7.8 kcal/mol which was not predicted for primers P1_4 and P1_68. The ability of primers P1_1 and P1_4 to form additional hairpin- and homodimer-like structures can offset the expected advantages of their stronger T7 promoters. This may be the reason for the observed decline in the yield of target amplicons for primers P1_1 and P1_4 which were expected to perform the best, based on their relative abundance values (Table 1 and Fig. 4). CONCLUSIONS The ranking of 8-nucleotide sequences right downstream of the T7 promoter core sequence by the performance of T7 promoters in in vitro transcription can provide a rational for designing efficient NASBA primers. The sequences characterized by the relative abundance vales of about 0.7 and above have to be considered first. However, among such sequences, the 8-nucleotide sequences with the highest RNA yield in in vitro transcription are not necessary to provide the most efficient amplification of target RNA amplicons in NASBA. A careful evaluation of the P1 primer ability to form secondary structures with DNA folding algorithms for selection of candidate P1 primers, followed by their experimental testing, are still required to find the best NASBA primer set. COMPLIANCE WITH ETHICAL STANDARDS This article does not contain any research involving humans or using animals as objects. FUNDING The study was performed within the framework of the Program for Basic Research in the Russian Federation for a long-term period (2021–2030) (No. 122030100170-5). CONFLICT OF INTEREST The authors declare no conflict of interest. REFERENCES
|